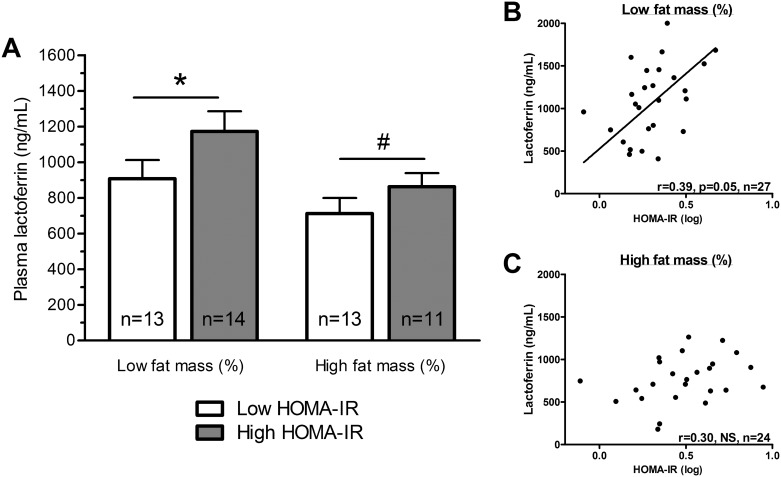
Fig 1. Plasma Lf levels in lean to moderately obese subjects.
(A) Plasma Lf concentrations were assessed in lean to moderately obese women following stratification performed according to median values of body fat mass (median = 34.8%) and HOMA-IR index (low fat mass group: median = 1.8; high fat mass group: median = 3.1). Correlations were tested between plasma Lf concentrations and HOMA-IR in subjects with body fat mass (%) (B) lower or (C) higher than the median Pearson correlation coefficients of log-transformed variables. P values are shown on the graph: * P<0.05; # P = 0.1.

