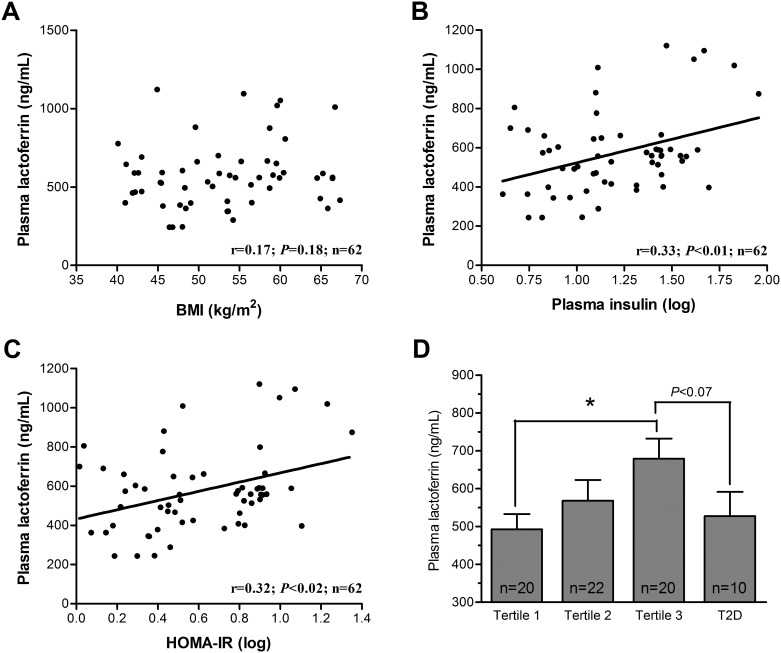
Fig 2. Plasma Lf levels in severely obese subjects.
Correlations were tested between plasma Lf concentrations and (A) BMI, (B) insulin and (C) HOMA-IR in severely obese subjects without T2D. Pearson correlation coefficients of log-transformed variables and P values are shown in the graph (n = 62); (D) Plasma Lf concentrations in severely obese patients according to HOMA-IR tertiles and to the presence of T2D. * P<0.05.

