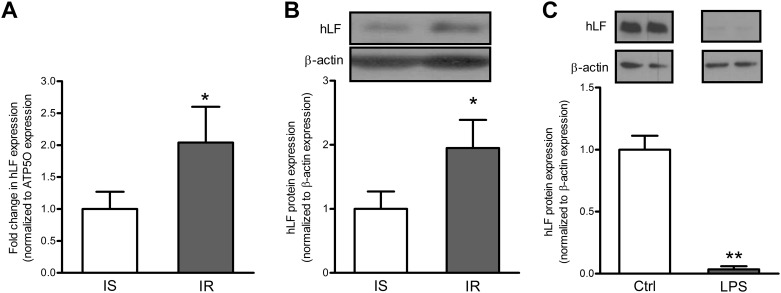
Fig 3. Intestinal Lf mRNA and protein expression in severely obese subjects and in Caco-2/15 cells.
mRNA and protein levels of Lf were estimated in the intestine of insulin-sensitive and insulin-resistant obese subjects (n = 9 per group). The relative mRNA fold-changes between groups were calculated using the 2−ΔΔCt method. mRNA data were normalized to ATP5O mRNA expression. Modulation of Lf protein following a 24-hour Caco-2/15 cell incubation with LPS (150 μg/mL). Protein expression values were normalized to β-actin protein expression. In B, samples were run on the same gel, but lanes were not contiguous. * P<0.05 vs. insulin-sensitive subjects, **p<0.001 vs. control cells.

