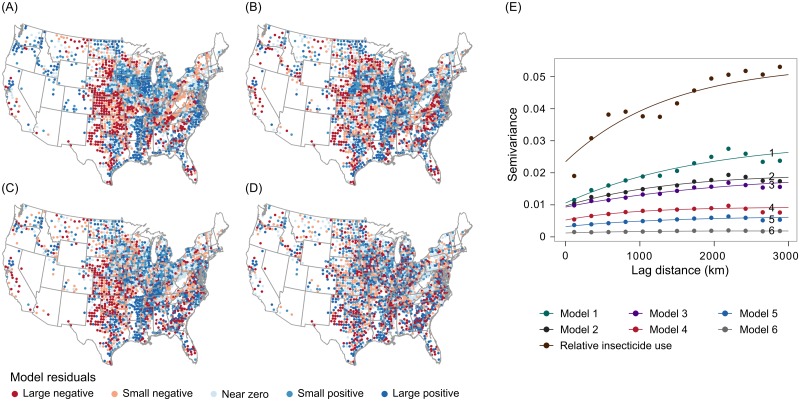
Fig 2. Maps of spatial structure in 2012 residuals from Model 1, Model 3, Model 5, and Model 6 (A-D, respectively), and empirical variograms with Matérn fits (E) for residuals of those models, as well as from Model 2 and Model 4, and the raw observed values of relative insecticide use.
Only 2012 data are shown, but very similar patterns occurred across all years.

