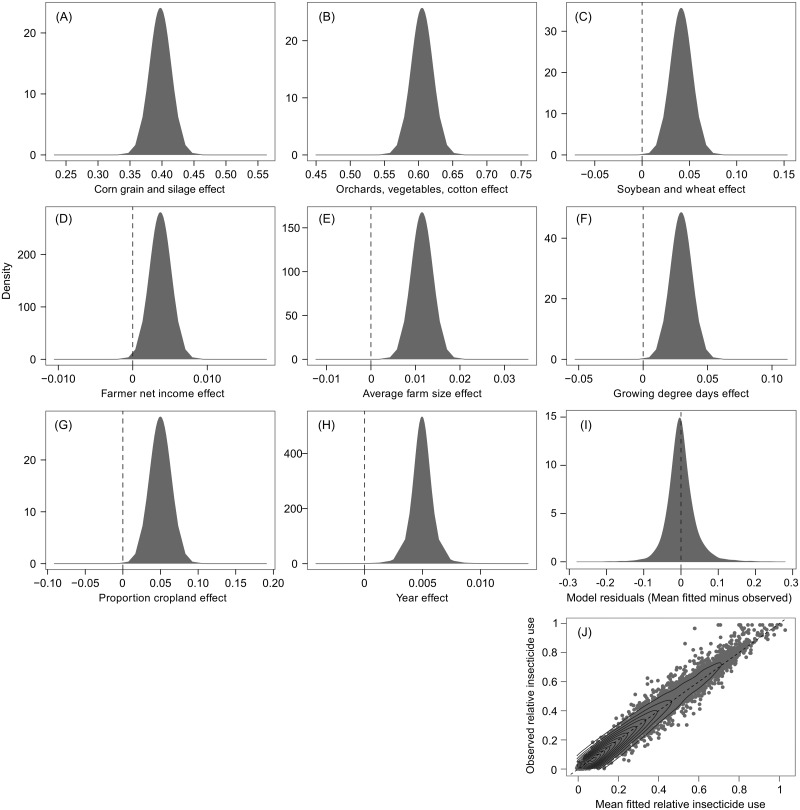
Fig 3. Posterior marginal distributions for fixed effects from Model 6, along with a histogram of model residuals and a plot of predicted versus observed relative insecticide use.
Vertical dashed lines (A-I) highlight parameter values of 0. The diagonal dashed line (J) indicates unity. Contour lines (J) illustrate data density.

