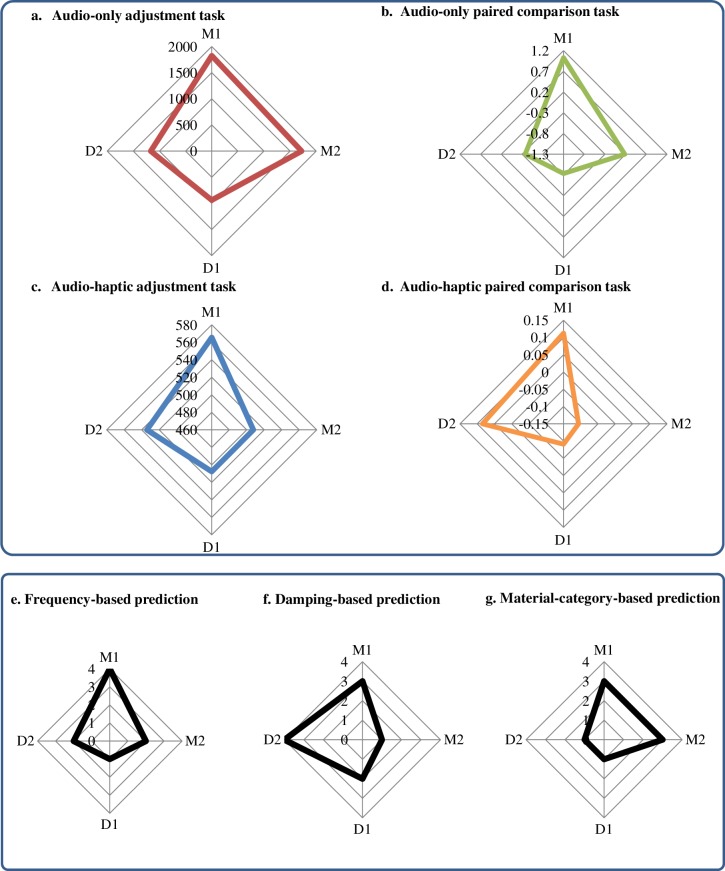
Fig 7. Stiffness of the four sounds (M1, D1, M2, D2).
Results of (a) audio-only adjustment task with values of adjusted stiffness (N/m); (b) audio-only stiffness comparison task with values showing the stiffness preference level; (c) audio-haptic stiffness adjustment experiment with values of adjusted stiffness (N/m); and (d) audio-haptic stiffness comparison task with values of stiffness preference level. These values are the averaged data across all of the haptic stiffness levels in each experiment. (e)–(g) show the predictions of the order of stiffness according to frequency (e), damping (f) parameters and material category (g). The values from 0 to 4 represent the order of stiffness from soft to hard.

