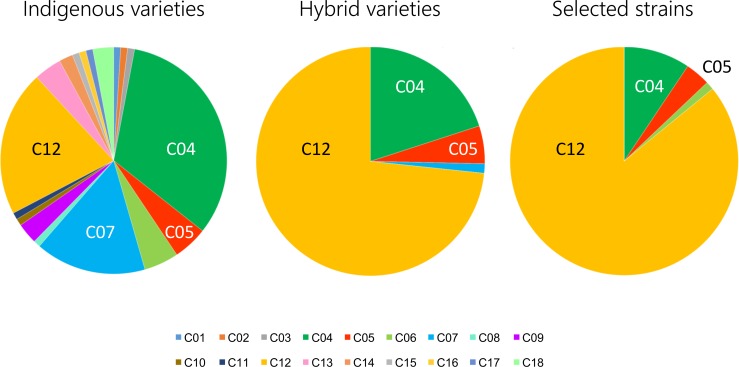
Fig 5. Organelle genome composition of the three sample categories.
Each pie chart shows the relative abundance of each cytotype within the three sample categories. C01: C. ichangensis type, C02: Mexican lime, C03: limonia type, C04: pummelo type, C05: hyuganatsu type, C06: lemon type, C07: sweet orange type, C08: Satsumakikoku type, C09: yuzu type, C10: Ichang lemon type, C11: kunenbo B type, C12: mandarin type, C13: sunki type, C14: tachibana type, C15: tachibana C type, C16: Ogimikugani type, C17: Cleopatra type, C18: koji type.

