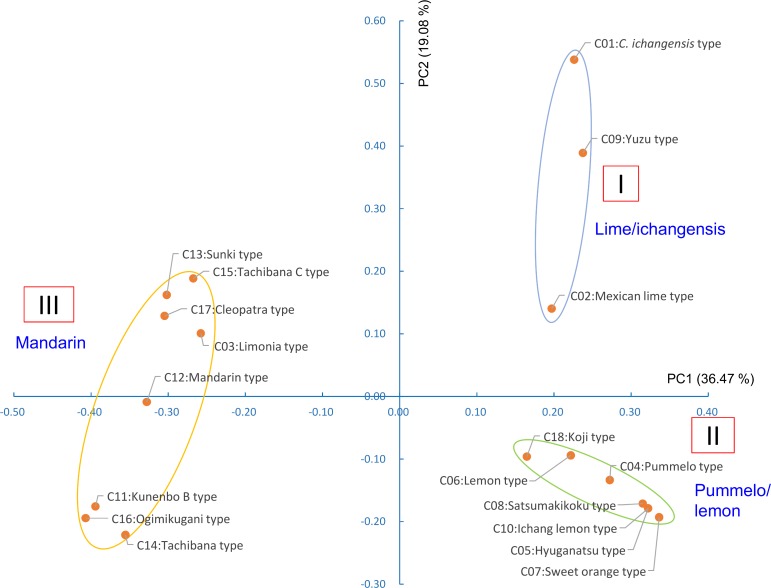
Fig 6. Principal coordinate analysis plot of 18 representative organelle genomes observed within 101 citrus indigenous varieties.
The plot was produced from modalities by Rogers and Tanimoto’s coefficient estimated from 11 organellar DNA markers. Three groups of genomes that cluster together are circled (I, II and III).

