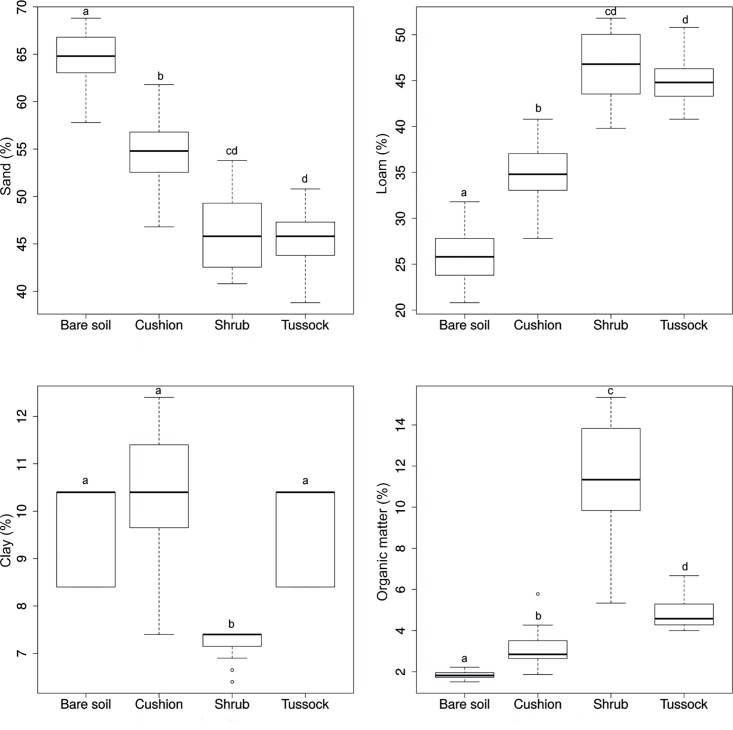
Fig 2. Boxplots of sand, loam, clay and organic matter content (%) of soil samples collected under the patches of ecosystem engineers and on bare soil.
Equal letters indicate no statistically significant differences (P ≥ 0.001) in the pairwise comparisons of groups as determined by the Mann-Whitney-Wilcoxon tests, after Holm’s correction for multiple comparisons.

