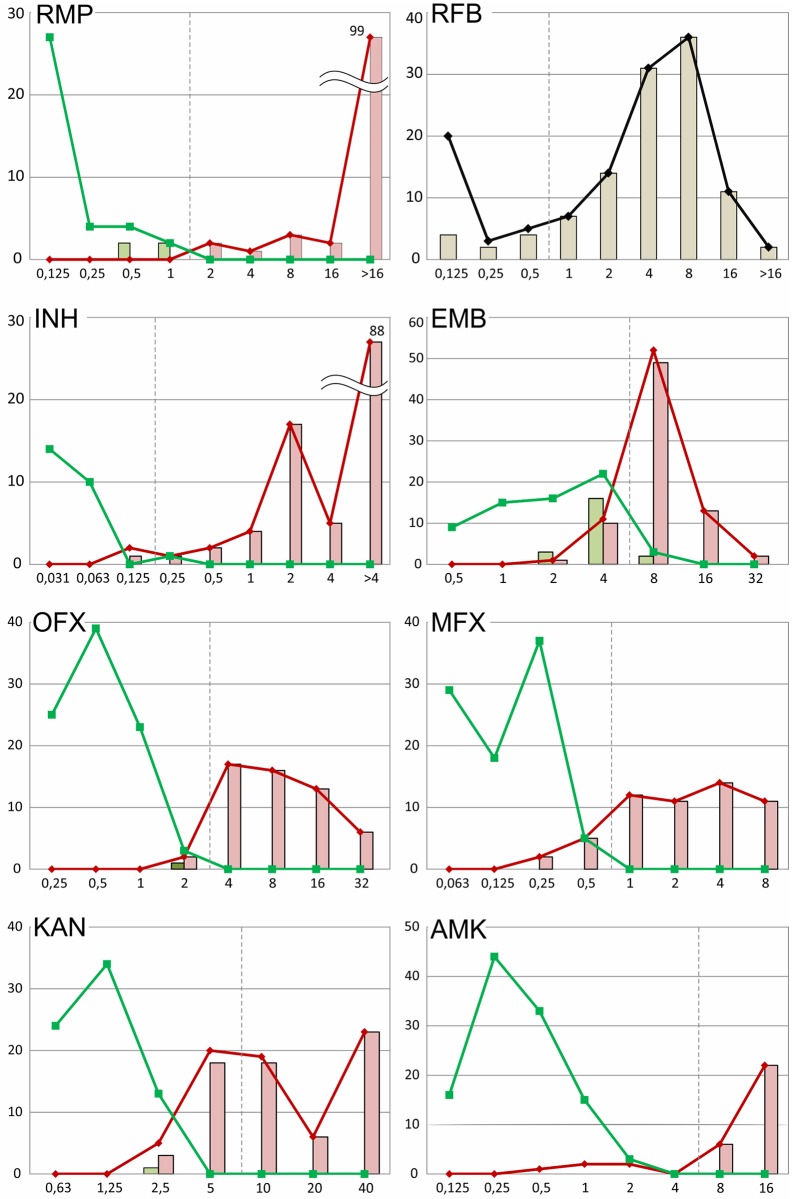
Fig 1. MIC distributions of the clinical isolates characterized using the MGIT and TB-TEST assays.
Resistant and susceptible isolates based on the MGIT results are indicated by the red and green lines, respectively. The light-red and light-green bars represent the numbers of resistant and susceptible isolates with mutations detected by the TB-TEST. The MGIT was not performed for rifabutin (RFB); therefore, only the distributions of all isolates and the isolates with mutations are shown.

