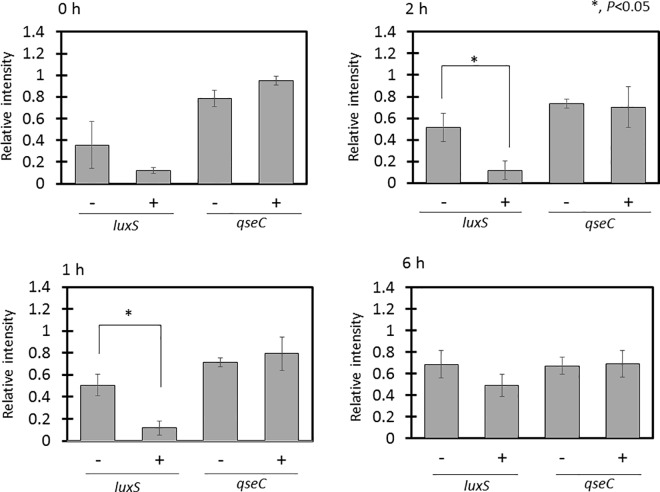
Fig 5. Transcript levels of H. influenzae 2013–86 biofilm-related genes.
Transcript levels of luxS and qseC were evaluated by semi-quantitative RT–PCR. Relative expression was calculated in comparison with the transcription level of gyrB. Each experiment was performed three times on separate occasions, and the data are shown as the mean ± SD. The P value was calculated by the Student's t-test.

