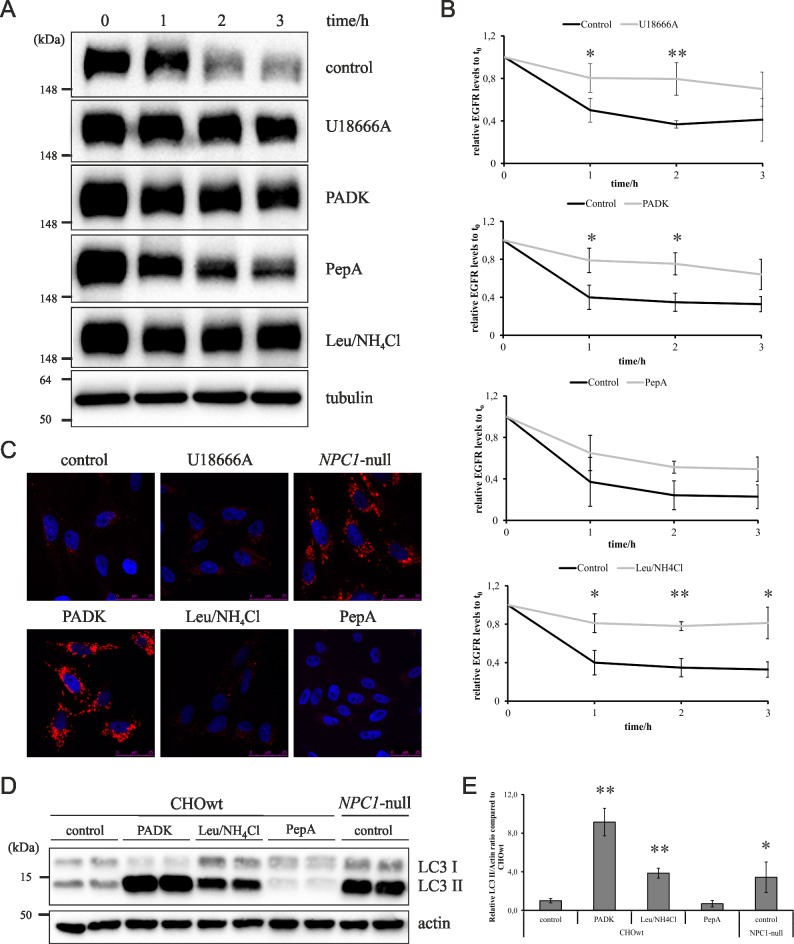
Fig 1. Inhibition of cathepsin B/L and not cathepsin D causes lysosomal dysfunction.
(A) EGFR degradation assay. Western blot analysis of EGFR in SH-SY5Y cells treated with different inhibitors at different time points. α-Tubulin was used as a loading control. (B) Quantification of Western blot results of the 3 independent experiments was performed by ImageJ. Student t-test was used for statistical analysis. Error bars present the mean ± standard deviation (* p < 0.05, ** p < 0.01). (C) Confocal microscopy of CHOwt cells treated with different inhibitors and CHO NPC1-null cells. LysoTracker (red) and Hoechst (blue). (D) Western blot of CHOwt cells treated with different inhibitors and CHO NPC1-null cells using LC3 antibody. β-Actin was used as a loading control. (E) Quantification of Western blot results of the 3 independent experiments was performed by ImageJ. Student t-test was used for statistical analysis. Error bars present the mean ± standard deviation (* p < 0.05, ** p < 0.01).

