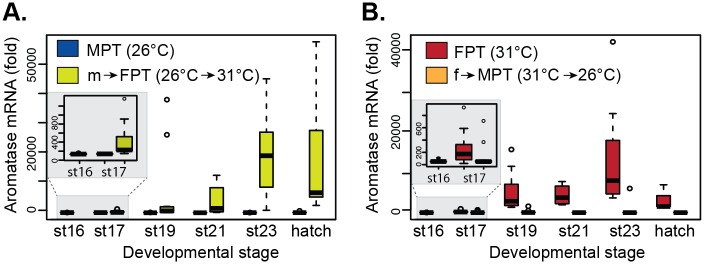
Fig 2. Gonadal aromatase mRNA expression during embryonic development.
Slider eggs were incubated at MPT or shifted from MPT to FPT (A) and at FPT or shifted from FPT to MPT (B). Each time point includes data from 8–12 embryos. Data shown with a median value (thick black line), 25th and 75th percentiles (lower and upper boundary of box), and maximum and minimum values (whiskers). Outliers are indicated with open circles. All pairwise comparison between control and shifted temperatures within each stage showed statistical significances (p < 0.05 by Wilcoxon rank sum test, p values available in S2 Table). Stage 16 is represented as a single data point as it is a baseline assessment before the temperature-shift treatments. The small squares within the larger graphs are the magnified view of the results of stage 16 and 17. MPT = male-producing temperature, FPT = female-producing temperature. m→FPT = temperature shift from MPT to FPT. f→MPT = temperature shift from FPT to MPT. St = embryonic stage.

