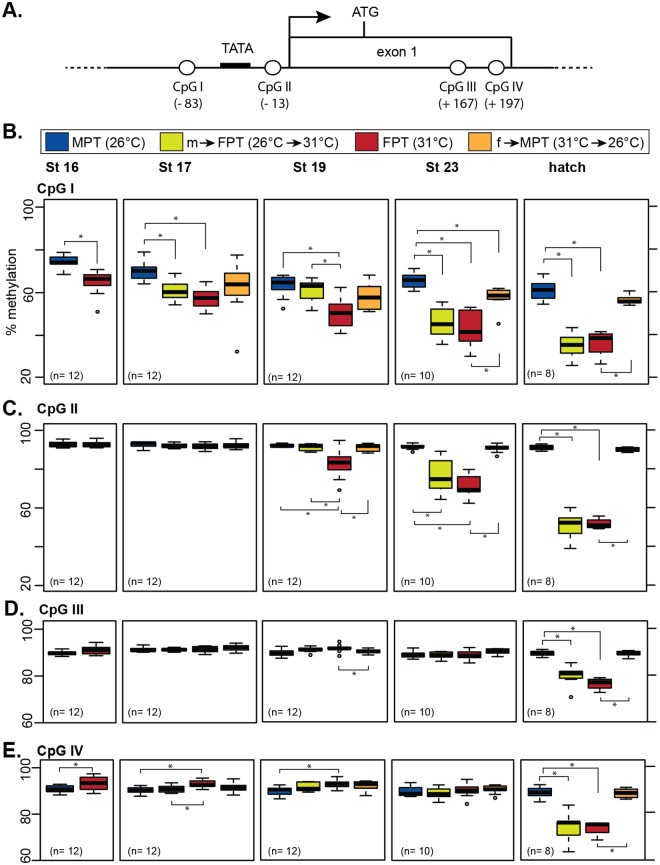
Fig 3. Developmental changes in DNA methylation patterns in the gonadal aromatase gene.
(A) CpG dinucleotide positions (CpGI-IV) in the gonadal aromatase gene. TATA = putative TATA box. Black arrow = transcription start site. ATG = translation start site. Parenthesis indicates the base pair position of the CpG dinucleotide relative to the transcription start site counted as +1. (B) Percent DNA methylation of individual CpG sites in the gonadal aromatase gene in embryonic gonads. Data shown with a median value (thick black line), 25th and 75th percentiles (lower and upper boundary of box), and maximum and minimum values (whiskers). Outliers are indicated with open circles. Statistical differences between groups are marked with asterisks (p < 0.05, pairwise Wilcoxon rank sum test). Statistical results between the two temperature-shifted groups (m→FPT and f→MPT) within a stage and results across stages within a temperature group are not shown to simplify the graph (p-values available in S2 Table). The average number of individuals per group in each stage is indicated in parenthesis. MPT = male-producing temperature, FPT = female-producing temperature. m→FPT = temperature shift from MPT to FPT, f→MPT = temperature shift from FPT to MPT. St = embryonic stage.

