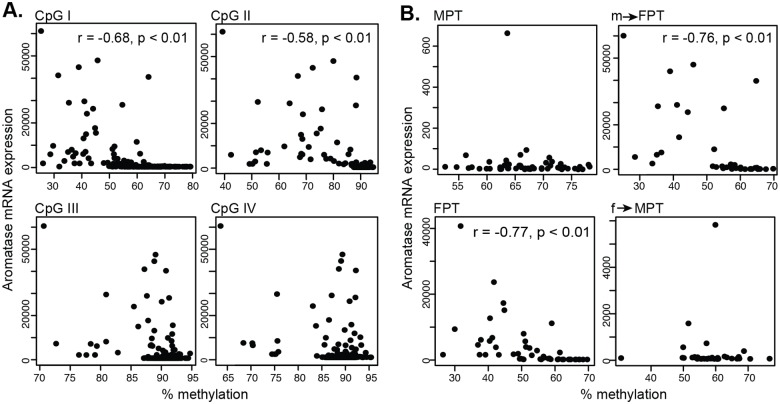
Fig 4. Scatter plots of aromatase mRNA expression against DNA methylation in gonads.
(A) Data from embryos were plotted according to each CpG position. Correlation coefficient (r) and p-values were examined by Spearman's rank correlation coefficient. (B) Aromatase mRNA expression was plotted against DNA methylation at CpGI according to the different temperature groups. MPT = male-producing temperature, FPT = female-producing temperature. m→FPT = temperature shift from MPT to FPT, f→MPT = temperature shift from FPT to MPT.

