
Figure 1. Propensity-matched analysis of the incidence of minor vascular complications following use of Perclose vascular closure device.
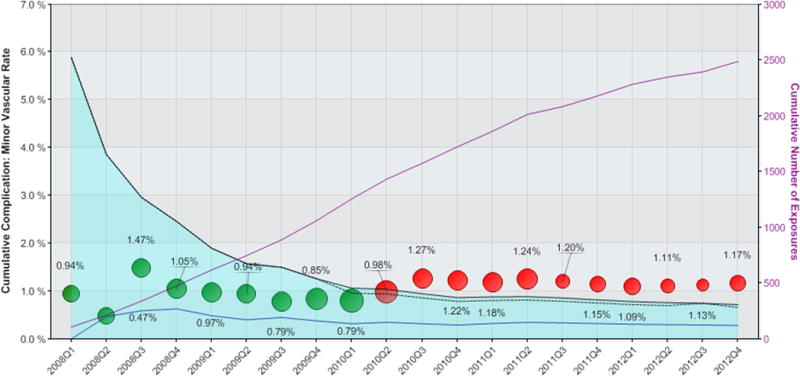
The cumulative rate of minor vascular complications for patients receiving the Perclose VCD are shown as circles, where the size of the circle is proportional to the number of Perclose vascular closure devices used during the calendar quarter. The light blue shaded area represents the 95% confidence interval, corrected for multiple comparisons, with black dashed lines representing the uncorrected 95% confidence limits. The solid blue line indicates mean event rates of matched patients receiving alternative vascular closure device Green circles indicate cumulative observed event rates for patients receiving Perclose fall within propensity-matched 95% confidence intervals. Red circles indicate safety alerts were triggered due to cumulative observed event rates exceeding the upper 95% confidence limits. The solid purple line denotes cumulative number of exposures as shown on the right-sided vertical axis.