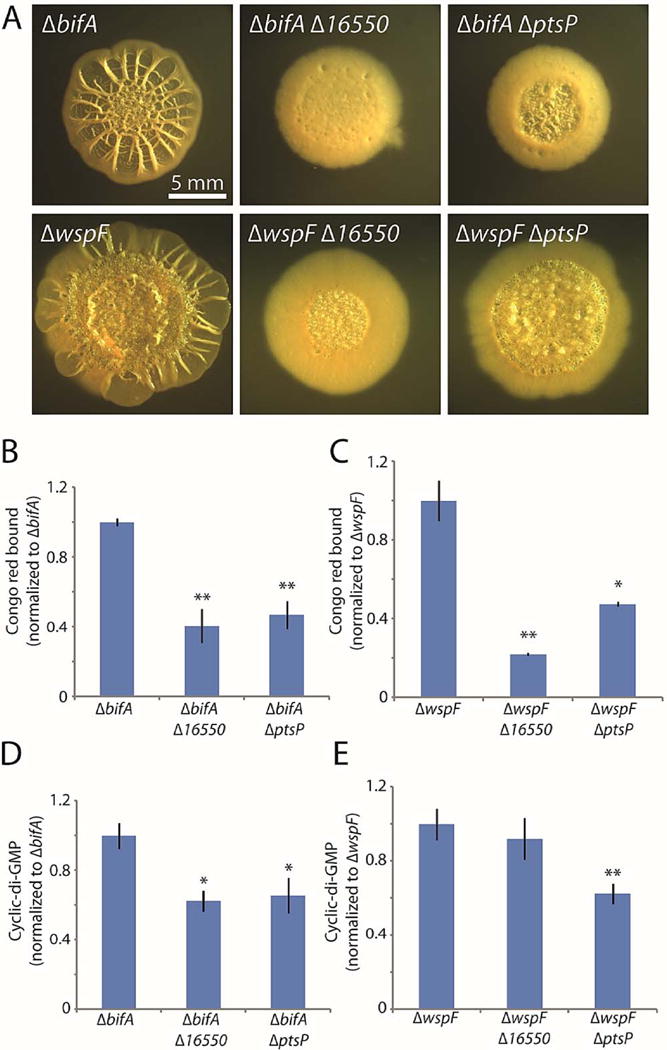
Figure 4. Deletions of 16550 and ptsP reduce biofilm formation by bifA and wspF mutants.

A. Colony morphologies (4 d for bifA, 6 d for wspF) of strains bearing markerless bifA or wspF deletions alone or in combination with markerless in-frame deletions of the three new genes identified in the screen. B and C. Congo red binding by the indicated colonies. D and E. c-di-GMP levels in the indicated colonies. For panels B–E, the mean values of at least 3 replicates are shown; error bars indicate ± 1 standard deviation. *, p < 0.05; **, p < 0.01 relative to the single mutants shown at the left of each graph.
