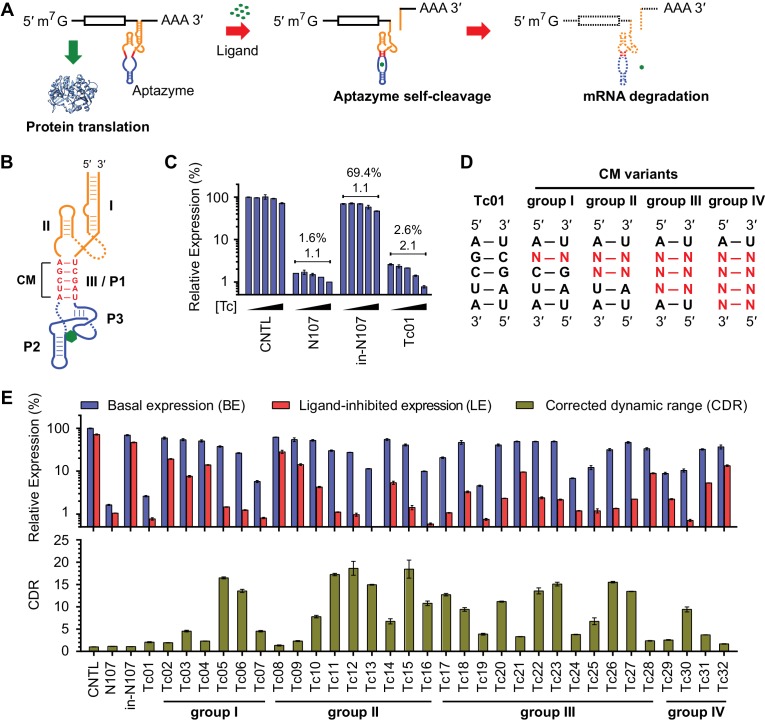
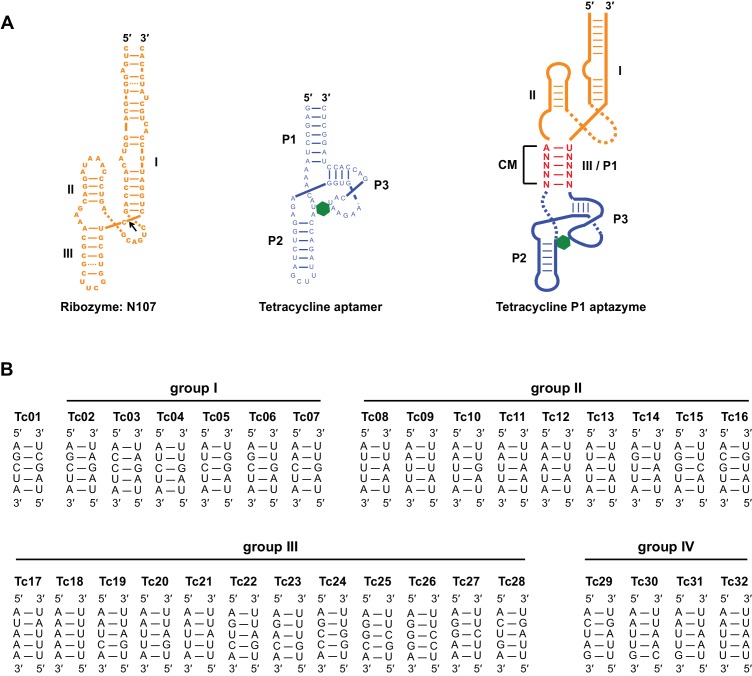
Figure 1. A test panel of 32 tetracycline (tc) aptazymes.
(A) A diagram representing aptazyme-mediated control of gene expression. An aptazyme riboswitch, composed of a ribozyme (orange), a communication module (red) and an aptamer (blue), is inserted at the 3' untranslated region of an mRNA transcript. Ligand binding to the aptamer activates the ribozyme, which cleaves itself in cis, leading to degradation of the RNA message. (B) Secondary structure of the Tc01 aptazyme, composed of a hammerhead ribozyme (orange), a communication module (CM, red), and a Tc-binding aptamer (blue). Tc is represented as a green hexagon. The original stem III of the hammerhead ribozyme and P1 stem of the Tc aptamer are replaced with the communication module, which connects the ribozyme and aptamer and signals the binding state of the aptamer to the ribozyme. (C) Enzymatically active (N107) and inactive (in-N107) forms of the N107 hammerhead ribozyme, or the aptazyme Tc01 were placed 3´ to a Gaussia luciferase (GLuc) gene. HeLa cells transiently transfected with plasmids expressing GLuc regulated by N107 or Tc01 were cultured with 0, 3, 10, 30, or 100 µM Tc for 2 days. Secreted GLuc in the culture supernatant was measured by a luminescence assay. Luciferase expression levels are normalized to that of an expression construct ('CNTL') lacking any regulatory elements. The percentages above the figure indicate 'basal expression' (BE), GLuc expression from each construct in the absence of Tc relative to that from the CNTL control construct. The lower number above each figure indicates the 'corrected dynamic range' (CDR) at 100 µM Tc. CDR is the Tc-induced fold-change in aptazyme-regulated GLuc expression divided by the Tc-induced fold-change in GLuc expression from the CNTL control construct. (D) To gain insight into the relationship between communication-module sequence and CDR, 32 aptazyme variants, differing only in their communication modules and represented here in four groups, were generated. Full communication-module sequences are shown in Figure 1—figure supplement 1B. (E) HeLa cells transiently transfected with plasmids expressing GLuc regulated by these 32 aptazyme variants were cultured in the presence or absence of 100 µM Tc for 2 days. Secreted GLuc in the culture supernatant was analyzed as in (C). The upper panel shows the BE (blue) and 'ligand-inhibited expression' (LE; red) of each variant. LE is the relative luciferase expression of each plasmid in the presence of Tc compared to the luciferase expression level of the CNTL control plasmid in the absence of Tc. The lower panel shows the CDR of each variant. All data shown are representative of two or three independent experiments. All data points represent mean ± S.D. of three biological replicates.


