. 2016 Nov 2;5:e18858. doi: 10.7554/eLife.18858

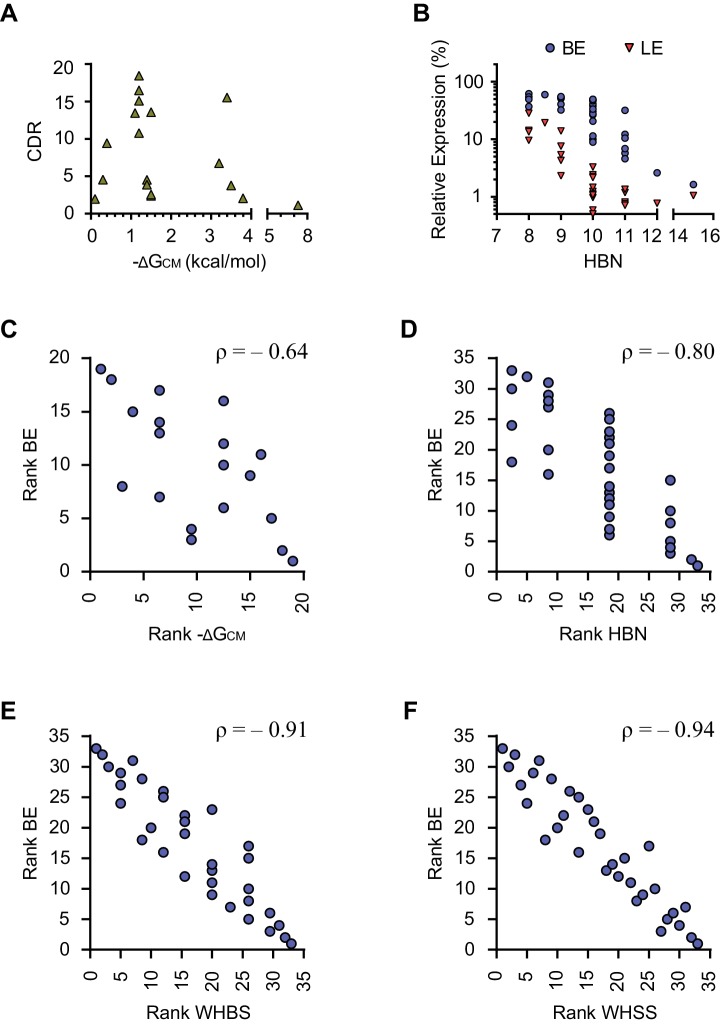
Figure 2. Development of rational-design principles.

(A) The predicted hybrid free energies of the communication modules (ΔGCM) of test-panel aptazymes were calculated with RNAstructure Web Server (Bellaousov et al., 2013). BE (blue circles) and LE (red triangles) were then plotted against the negative ΔGCM value for all aptazymes whose ΔGCM could be determined. Note the poor correlation between ΔGCM and BE or LE. (B–C) BE and LE of the indicated aptazyme variants are shown. Expression levels are normalized to that of the CNTL control construct. The communication-module sequences of these variants are displayed to the left of the figures. Red indicates base pairs different from the consensus. Note that all constructs in each set have the same base pairs, and that order of these pairs impacts BE. (D) Accordingly, every CM base pair was assigned a weight based on its proximity to the ribozyme, with distal bases assigned lower weights. A Weighted Hydrogen Bond Score (WHBS) was then calculated as the weighted sum of hydrogen bonds in the communication module. BE (blue circles) and LE (red triangles) of each variant were plotted against WHBS. Note that WHBS better correlates with the rank order of BE than does ΔGCM or the unweighted sum of hydrogen bond numbers in the communication module (Figure 2—figure supplement 1B). (EF) The BE and LE of the indicated aptazymes are shown, with their communication-module sequences indicated to the left. Nucleotides with the potential to form inter-strand base-stacking interactions are highlighted as red. (G) Potential inter-strand purine base-stacking interactions were weighted by proximity to the ribozyme, and added to the WHBS to form a modified score (WHSS). BE (blue circles) and LE (red triangles) were plotted against WHSS of the corresponding aptazyme variant. Note that the WHSS better correlates with the rank order of BE than does the WHBS or ΔGCM. An inflection point of the BE at WHSS 6.7 is indicated with a dashed line. Shading indicates a region with WHSS values 6.7 ± 0.3. (H) The CDR values of all 32 test-panel aptazymes were plotted against their WHSS. Note the CDR optimum near the WHSS value of 6.7 (shaded). Aptazymes that exhibited the highest (Tc12, Tc15) or lower-than-expected (Tc31 and Tc32) CDRs are indicated. (IK) The CDRs of the indicated aptazymes are shown, with their communication-module sequences displayed to the left. Note that aptazymes in each panel share identical sequences (I) or similar WHSS (J,K), but differ in the stability of the communication-module base pair immediately proximal to the Tc aptamer (red). Aptazyme WHSS values range from 6.13 to 6.29 in (J), and from 6.58 to 6.63 in (K). Tc31 and Tc32, with 1 and 0 hydrogen bonds at this position, are outliers in Figure 2H, likely because these weak bonds destabilize the aptamer, and lower its affinity for Tc. (L) Efficient aptazymes met two criteria: a communication-module WHSS value within the range of 6.7 ± 0.3, and an aptamer-proximal communication-module base pair with stability similar to or higher than that of the original aptamer. Aptazymes that meet both criteria have high BE and CDR ('optimal' aptazymes), whereas those that fail to meet one have low BE or narrow CDR ('suboptimal' aptazymes). The CDR and BE of the both optimal and suboptimal aptazymes are ordered by CDR and plotted. Data points in panels A, D, G, H and L represent mean of three biological replicates. Data points in panels B, C, E, F, I, J, and K represent mean ± S.D. of three biological replicates. Numerical data for all the figures are available in Figure 2—source data 1.

DOI: http://dx.doi.org/10.7554/eLife.18858.005

Figure 2—source data 1. Communication-module scores and expression values of test-panel Tc aptazymes.
Predicated ΔG of the communication module (ΔGCM), total number of communication-module hydrogen bonds (HBN), a Weighted Hydrogen Bond Score (WHBS), and Weighted Hydrogen-bond and Stacking Score (WHSS) of each test-panel Tc aptazyme are listed along with its observed basal expression (BE) at 0 µM Tc, ligand-inhibited expression (LE) at 100 µM Tc and corrected dynamic range (CDR). n.d. indicates that ΔGCM could not be determined. BE and LE are shown as the percentage of GLuc expression normalized to expression of the CNTL control construct lacking any aptazyme. Aptazymes classified into the optimal group in Figure 2l are shaded. BE, LE and CDR are shown as mean ± S.D. Data are representative of two or three independent experiments.
DOI: 10.7554/eLife.18858.006

Figure 2.

Figure 2—figure supplement 1. Correlation analysis of energy-like functions describing the communication modules.

Figure 2—figure supplement 1.

(A) The predicted hybrid free energies of the communication modules (ΔGCM) of the test-panel aptazymes were calculated with RNAstructure Web Server. Corrected dynamic ranges (CDR) of the test panel aptazymes were then plotted against the negative ΔGCM values for communication modules whose ΔGCM could be determined. (B) Basal expression (BE) and ligand-inhibited expression (LE) were plotted against total hydrogen bond numbers (HBN) of the communication modules of the test-panel aptazymes. (C) BE and negative ΔGCM of the test-panel aptazymes were ranked separately for Spearman’s rank correlation analysis. Ranked BE were plotted against ranked negative ΔGCM. The Spearman’s rank correlation coefficient (ρ) is shown above the figure. (D–F) Spearman’s rank correlation between BE and HBN (D), Weighted Hydrogen Bond Score (WHBS; E), or Weighted Hydrogen-bond and Stacking Score (WHSS; F) were analyzed as in (C). Note that WHSS correlates better with BE than does ΔGCM, HBN, or WHBS.
Figure 2—figure supplement 2. The relationship between aptazyme activation and dynamic range.

Figure 2—figure supplement 2.

(A) When messenger RNAs (mRNA) containing an aptazyme are transcribed, a fraction of the mRNA population will undergo ribozyme autoactivation, resulting in mRNA degradation. Ribozyme autoactivation reduces gene expression to BE and is primarily determined by the communication module sequence (CM; red). Ligand-aptamer binding triggers a conformational change in the aptamer. The communication module signals this change to the ribozyme. Subsequent activation of the ribozyme lowers gene expression to LE. (B) A plot of BE versus WHSS as shown in Figure 2G. The curve shows how gene expression responds to differences in an inferred energy-like function of the communication-module sequence (WHSS), and contains an inflection point at a WHSS value of 6.7. A region near this inflection point (± 0.3) is shaded. (C–D) Diagrams explaining why high levels of ligand-induced ribozyme activation (BE – LE) were observed at WHSS 6.7, the observed inflection point in (B). Energy contributed by the communication module triggers ribozyme autoactivation (blue brackets), lowering gene expression to BE (blue bars) from expression observed with an inactive ribozyme (dashed lines). When the ligand binds the aptamer, it stabilizes the communication module by adding additional energy (Δ), increasing the frequency of ribozyme activation (induced activation, red brackets), and further decreasing gene expression to LE (red bars). Note that identical Δ values have greater impact on the dynamic range of aptazymes with WHSS values near the inflection point (C) than on those with WHSS values far from this point (D)