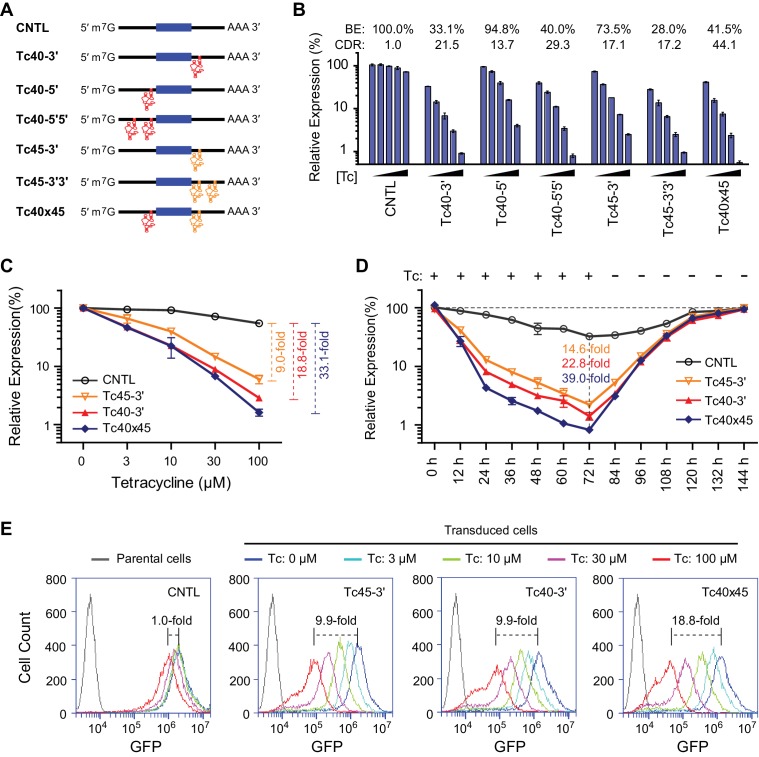
Figure 4. Control of retroviral vectored transgene expression using rationally designed Tc aptazymes.
(A) A representation of the reporter constructs tested. Tc40 (red) or Tc45 (orange) were inserted either upstream (5′) or downstream (3′) of the GLuc gene (filled blue box), either as a single copy (Tc40-5′, Tc40-3′, or Tc45-3'), in tandem repeats (Tc40-5′5′ or Tc45-3′3′), or across the Gluc gene (Tc40×45). (B) Plasmids containing the Tc variants represented in (A) were tested by transient transfection. Transfected HeLa cells were cultured with 0, 3, 10, 30, or 100 µM Tc for 2 days. Secreted GLuc in the culture supernatant was measured by a luminescence assay. Luciferase expression levels are normalized to that of the CNTL control construct. BE and CDR at 100 µM Tc are shown above the figure. (C) HeLa cells were transduced with murine-leukemia virus (MLV) vectors expressing GLuc genes regulated by the indicated Tc aptazyme variants and selected by puromycin. Stably transduced cells were cultured with the indicated concentrations of Tc for 48 hr. Secreted GLuc in the supernatants was measured by luminescence assay. Luciferase expression level was normalized to that observed without Tc. CDR at 100 µM Tc is indicated with brackets at the right. (D) Stable cells characterized in (C) were cultured in 100 µM Tc for 72 hr. Tc was then withdrawn and the cells were cultured for an additional 72 hr. Cell culture supernatants were collected and replaced with fresh medium every 12 hr. Secreted GLuc in the supernatants was measured by luminescence assay. Luciferase expression levels at each time point were normalized to those observed before Tc was added. CDR observed at 72 hr for each aptazyme variant is indicated. (E) Assays similar to those in (C) except that a destabilized enhanced green fluorescent protein (GFP) was used as a reporter, and flow cytometry was used to measure expression. CDR at 100 µM Tc is indicated with brackets. Data shown are representative of two or three independent experiments. Data points in panels B–D represent mean ± S.D. of three biological replicates. Data points in panel E are representative of three biological replicates.


