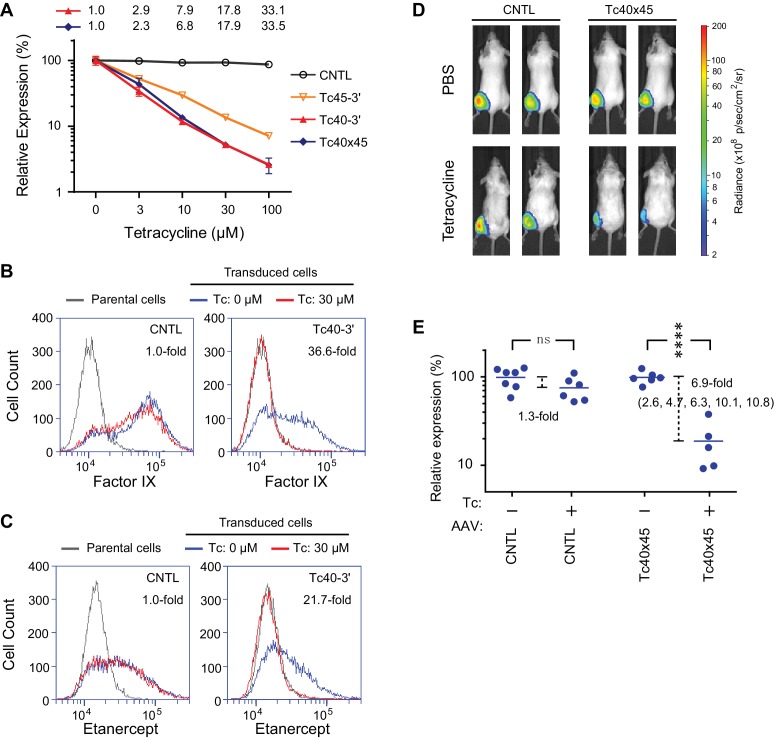
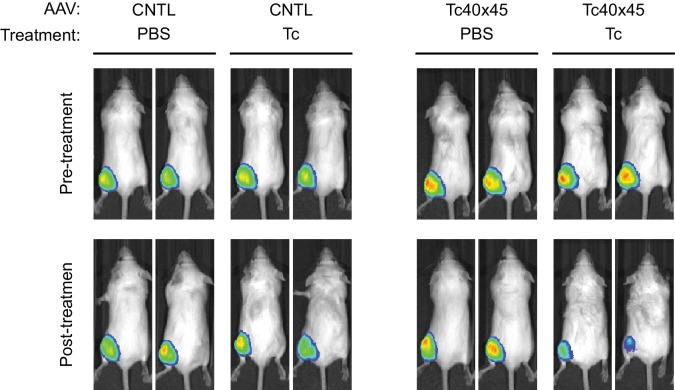
Figure 5. Aptazyme-mediated control of adeno-associated virus (AAV) vectored transgene expression.
(A) HeLa cells were transduced with AAV vectors expressing GLuc regulated by the indicated aptazymes and were cultured with the indicated concentrations of Tc for two days post-transduction. Luciferase expression level was normalized to that observed without Tc. CDR for Tc40-3′ and Tc40×45 is indicated above the figure. (B) HeLa cells were transduced with an AAV vector expressing human coagulation factor IX regulated (right panel) or not (left panel) by Tc40-3′. Cells were then incubated in presence (red) or absence (blue) of 30 µM Tc for two days and analyzed by flow cytometry using intracellular staining with an anti-human factor IX antibody. Grey indicates parental HeLa cells stained with the same antibody. CDR is indicated in the upper right corner of the panels. (C) An experiment similar to that in (B) except that cells were transduced with an AAV vector expressing etanercept (Enbrel), and stained with an anti-human IgG1 Fc antibody. (D) Fourteen 9-week old female BALB/c mice were injected with 1011 genome copies of AAV particles carrying GLuc gene regulated (Tc40×45, seven mice) or not (CNTL, seven mice) by Tc40×45 into the left gastrocnemius muscle. All mice were treated for 3 days with Tc (250 mg/kg) or phosphate-buffered saline (PBS) two weeks post-injection, and imaged for luciferase expression using the Xenogen IVIS In-Vivo Imager. (E) Bioluminescent photon outputs of all the imaged mice were analyzed using the Living Image Software. Relative luciferase expression was calculated as the percentage of bioluminescent photon output relative to the average photon output of PBS-treated mice injected with same AAV vector. Each point represents one mouse, and bars indicate the average expression level for each treatment group. Average fold changes of the luciferase expression between Tc- and PBS-treated groups are indicated. Numbers in the parentheses are the fold regulation of individual Tc-treated mice injected with Tc40×45-regulated vector. Differences between Tc- and PBS-treated groups were significant (two-sided t-test, p<0.0001) in mice injected with the Tc40×45-regulated vector, whereas differences in the control mice were not significant (two-sided t-test, p>0.05). Data shown in (A–D) are representative of two or three independent experiments. Data points in panel A represent mean ± S.D. of three biological replicates. Data points in panel B and C are representative of three biological replicates.


