
Fig. 4.
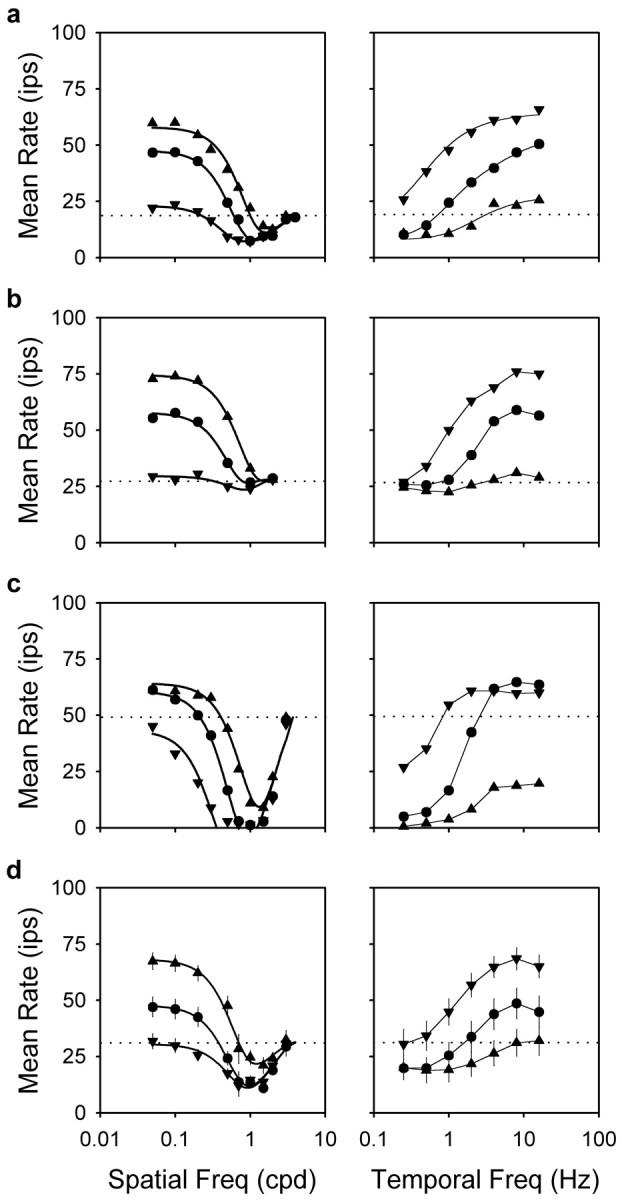
Spatiotemporal characteristics of the mean-changing subunits. Left, Spatial frequency curves of the mean rate for remote gratings of 0.25 Hz (downward triangles), 1 Hz (circles), and 4 Hz (upward triangles) for two OFF-Y-cells (a, 2908; c, 3003), an ON-Y-cell (b, 2917), and a group of 13 Y-cells (d; average curves). Error bars indicate SEMs. Thick linesgive the best fit of the dual-subunit model (see Fig. 5) to the data. Parameters of the fits in a–c for the 1 Hz grating areKE = 39, 30, and 69 ips;KIC = 13, 0, and 78 ips;RE = 0.56, 0.73, and 0.60°; andRIC = 0.13, indeterminate, and 0.15°, respectively. Those for the 0.25 and 4 Hz grating are not provided to conserve space. Parameters for group average fits are listed in Table 1. Right, Temporal frequency curves of the mean rate for remote gratings of 0.1 cpd (downward triangles), 0.5 cpd (circles), and 1 cpd (upward triangles) for the three cells (a–c) and the group average (d).Thin lines connect data points of common spatial frequency. Dotted lines give the resting rate of the three cells and the average resting rate for the group of cells. Disk diameter, 10–15°; grating contrast, 50%.