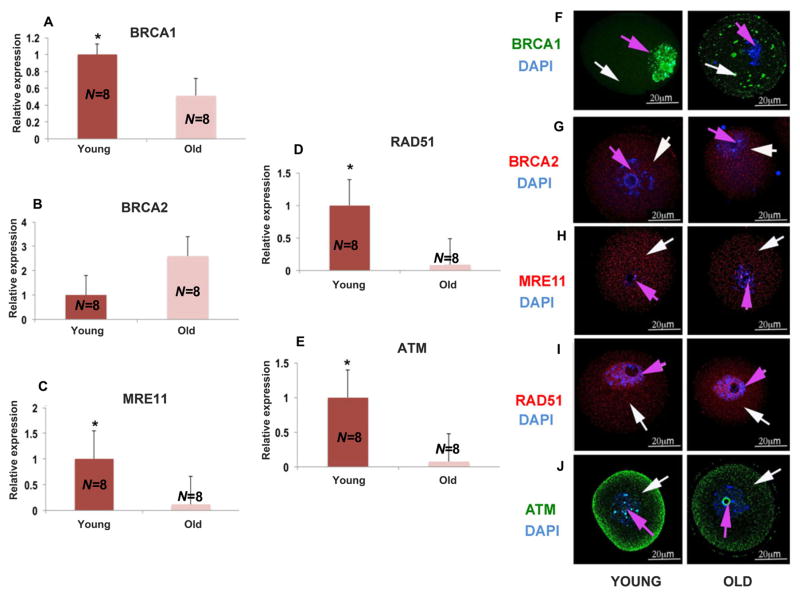
Fig. 2. Expression of DNA repair genes and proteins in mouse oocytes.
Significant decrease in the expression of DNA repair genes in old mice (11 to 12 months) compared to young mice (4 to 5 weeks) shown by real time PCR. All results are mean ± S.E.M., N=8/group. Bar graphs represent the gene expressions and photomicrographs represent the protein expressions. The bar graphs show significantly lower levels of expression for (A) BRCA1, (C) MRE11, (D) RAD51, and (E) ATM in old mice compared to young mice (**P<0.001; Student’s t test). (B) Shows a nonsignificant change in BRCA2 expression levels in old mice compared to young mice (P=0.2; Student’s t test). The representative photomicrographs show lower amounts of (F) BRCA1 (green), (H) MRE11 (red), (I) RAD51 (red), and (J) ATM (green) protein expression in old mice compared to young mice. Oocytes were counterstained with DAPI (blue). (G) No significant difference was detected in BRCA2 protein expression patterns in young and old mice. White arrow points to the cytoplasm and pink arrow to the nucleus. All bar graphs show the mean ± S.E.M.

