Fig. 6.

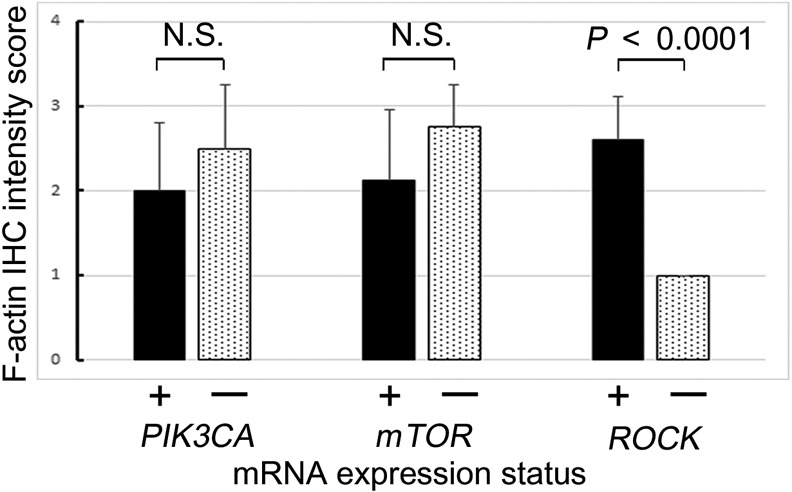
Immunohistochemical F-actin intensity score in tumor cells evaluated as negative (0), weak (1+), moderate (2+), and strong (3+) for tumors with RhoA overexpression. The x-axis shows the expression status of each target mRNA.

Immunohistochemical F-actin intensity score in tumor cells evaluated as negative (0), weak (1+), moderate (2+), and strong (3+) for tumors with RhoA overexpression. The x-axis shows the expression status of each target mRNA.