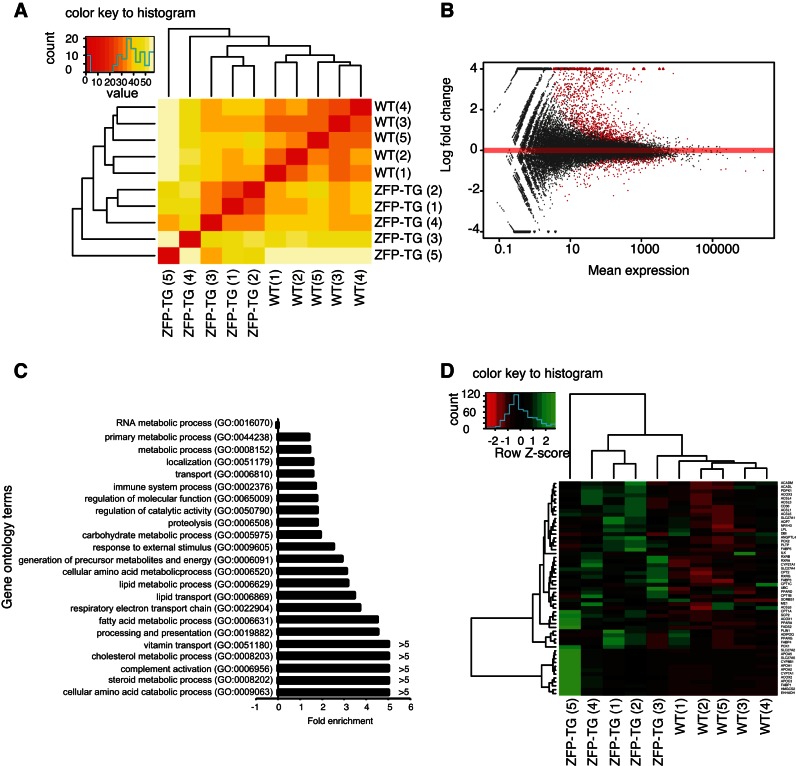
Fig. 4.
ZFP407 overexpression alters the muscle transcriptome. A and B: gene expression analysis in muscle from ZFP-TG and WT mice (n = 5/group) analyzed by hierarchical clustering of the transcriptome in ZFP-TG and WT mice (A) and volcano plot of gene expression (B), with differentially expressed genes indicated in red. C: fold enrichment of gene ontology terms among differentially expressed genes between ZFP-TG and WT mice. D: heat map of gene expression for the peroxisome proliferator-activated receptor (PPAR) KEGG pathway (03320). ZFP-TG 1–5 and WT 1–5 indicate individual biological replicates. Red, decreased relative expression; green, increased relative expression.

