Fig. 2.
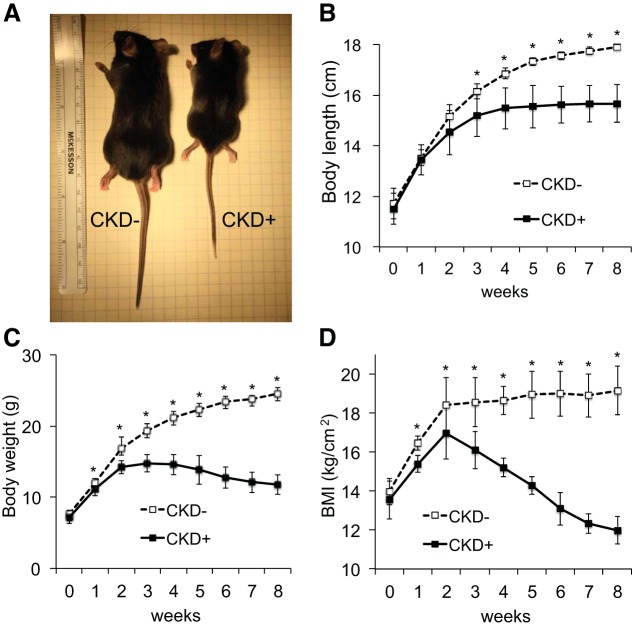
Growth rate in juvenile adenine-induced chronic kidney disease (CKD). Body length and weight were measured at the beginning of experiment and then weekly for 8 wk in mice fed 0.2% adenine diet (n = 9) and their littermates fed the control diet (n = 9). Body length was measured as a nose (snout) to tail tip length of the Isoflurane anesthetized animals. Half of this length was used to calculate body mass index (BMI) as weight (kg)/[length (cm)]2. A: representative images of the littermates fed control diet (left) and adenine diet (right). Adenine-fed mice [CKD(+)] were, on average, 2.1 cm shorter than controls [CKD(−)] at the end of the experiment. B: body length over the course of the experimental period. The differences in body length became significant after 3 wk of the experimental diet and continued to escalate during the remainder of the experimental period. While control animals continued to grow, mice with adenine-induced CKD demonstrated growth stunting from week 4 onwards. C: body weight. CKD(+) group had slower rate of weight gain and mice began losing weight by 3 wk of the experiment. D: BMI. After an initial brief increase in BMI, mice with CKD developed drastic reduction of BMI which by 6 wk fell below the baseline BMI. Error bars represent SD. *P < 0.05.

