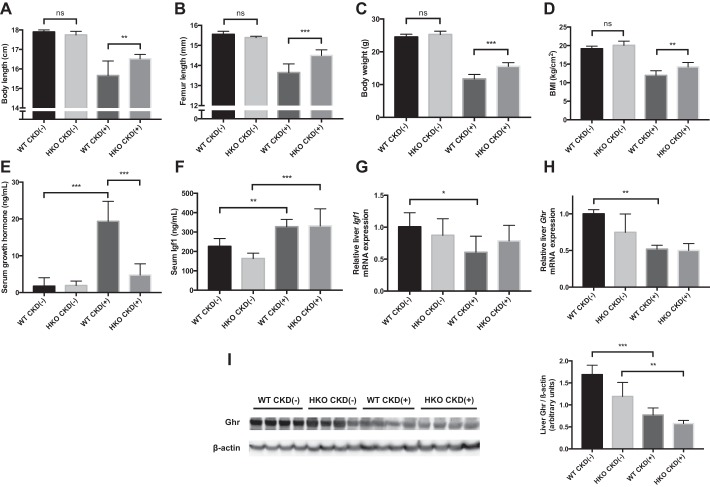
Fig. 3.
Relative effects of adenine diet on growth parameters in wild-type (WT) and HKO mice. Growth parameters were measured in four groups of mice: CKD(−) WT controls (n = 9), CKD(−)HKO controls (n = 5), CKD(+) WT (n = 9), and CKD(+) HKO (n = 6). A: body length at euthanasia in four groups of mice was measured as a nose to tail tip length. No significant differences in body length were observed between control WT and control HKO mice fed a regular diet. In contrast, the body length of CKD(+) WT mice was significantly shorter than the body length of CKD(+) HKO mice (15.7 ± 0.7 vs. 16.5 ± 0.2 cm respectively, P = 0.01). B: femur length at euthanasia in four groups of mice was measured radiographically at the time of micro-computed tomography. The control CKD(−)HKO group had slightly shorter femurs than control CKD(−)WT mice, while in the CKD(+) groups, HKO mice had significantly longer femurs than the WT mice (14.5 ± 0.3 vs. 13.6 ± 0.4 mm, respectively, P < 0.001). C: body weight at euthanasia was not different between controls. In contrast, CKD(+) HKO mice had increased body weight compared with CKD(+) WT controls. D: BMI was not different between control groups (bars at left) but CKD(+) HKO mice had higher BMI than CKD(+) WT. E: serum growth hormone (Gh) concentration was 10-fold elevated in CKD(+) WT mice compared with CKD(−)WT controls; no statistically significant differences in Gh concentration between CKD(+) HKO and CKD(−)HKO groups were found (P = 0.75). F: serum IGF1 concentration was elevated in both CKD(+) groups compared with their respective CKD(−)controls. G: in contrast to serum changes, liver mRNA expression of Igf1 was significantly reduced in the WT mice with CKD compared with WT controls. No differences in liver Igf1 mRNA expression between CKD(−)HKO and CKD(+) HKO groups were seen. H: liver mRNA expression of growth hormone receptor (Ghr) was significantly reduced in CKD(+) WT mice compared with CKD(−)WT controls. In HKO mice the differences did not reach statistical significance (P = 0.3). I: Western blot analysis demonstrated decreased GHR protein concentration in the liver of CKD(+) mice compared with CKD(−) controls, more so for the WT group. Four liver samples per group were used for PCR and western blot. Error bars represent SD. * P < 0.05; **P < 0.01; *** P < 0.001.

