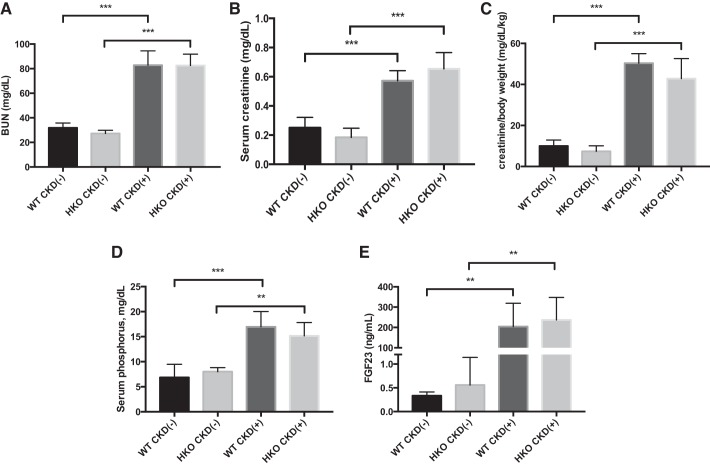
Fig. 6.
Effects of adenine-induced CKD on renal function and mineral metabolism in WT and HKO mice. A: blood urea nitrogen (BUN) was 2.5-fold elevated in CKD(+) groups compared with CKD(−)controls. No differences between CKD(+) WT vs. CKD(+) HKO groups were seen. CKD(−) WT controls were also not different from CKD(−) HKO controls. B: serum creatinine was 2.5 elevated in CKD(+) groups compared with CKD(−) controls. There were no significant differences in serum creatinine between WT and HKO juvenile mice fed the adenine diet. C: serum creatinine normalized to body weight was 5-fold higher in CKD(+) adenine-fed groups compared with CKD(−) control groups. D: serum phosphorus. Both CKD(+) WT and CKD(+) HKO groups had severe hyperphosphatemia. No significant differences between CKD(+) WT and CKD(+) HKO groups were observed. E: Fibroblast growth factor 23 (FGF23) was elevated in CKD(+) WT and CKD(+) HKO groups compared with their respective controls. No significant differences between CKD(+) WT and CKD(+) HKO groups were observed. Error bars represent SD. *P < 0.05; **P < 0.01; *** P < 0.001.

