Fig. 4.
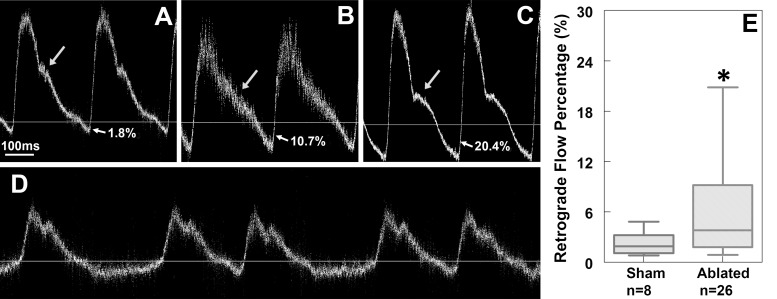
CNCC-ablated embryos have abnormal flow profiles at HH stage 19–20. A–D: pulsed Doppler traces from 1 sham control embryo and 3 CNCC-ablated embryos. A pulse Doppler trace from a control embryo typically has a large positive peak (forward flow) with a prominent shoulder (arrow in A) and a very small negative peak (retrograde flow). Retrograde flow percentage (indicated by arrows and percentages in A–C) is calculated as the ratio of negative to positive peak area. In some CNCC-ablated embryos, the prominent shoulders (arrows in A and C) disappear (arrow in B). Retrograde flow percentages of the 2 examples are 10.7% and 20.4% for B and C, respectively. D: pulse Doppler trace from another experimental embryo that exhibited an arrhythmia. E: box plot of retrograde flow percentage for control and experimental groups. Box represents 25–75%; whiskers represent range. *P < 0.05.

