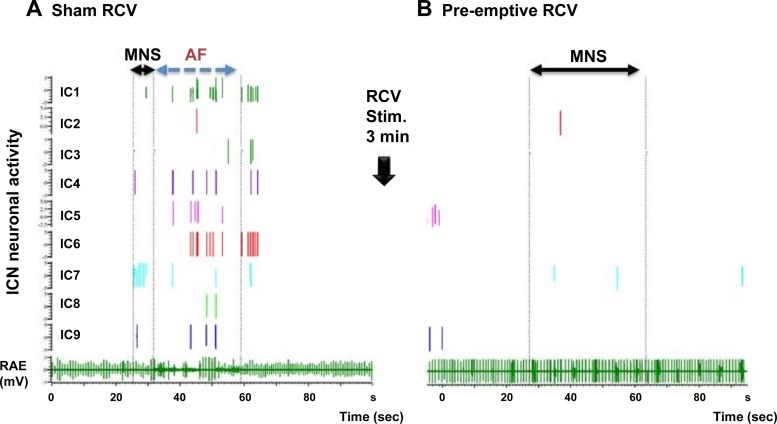
Fig. 3.
Representative responses to MNS before (A) and after (B) RCV VNS. A right atrial electrogram (RAE, bottom) is displayed with concomitant activities generated by 9 identified IC neurons. A: control state where AF was induced by right-sided MNS. B: response when the same MNS site was stimulated 1 min following 3 min of preemptive right-sided VNS. Horizontal solid arrows delimit time of MNS nerve stimulations. Broken vertical lines (A) indicate duration of AF induced by MNS. Note that following RCV (B), MNS failed to induce AF, even when applied for a longer time period (20 s). IC activity correspondingly remained unchanged during and following MNS stimulation.

