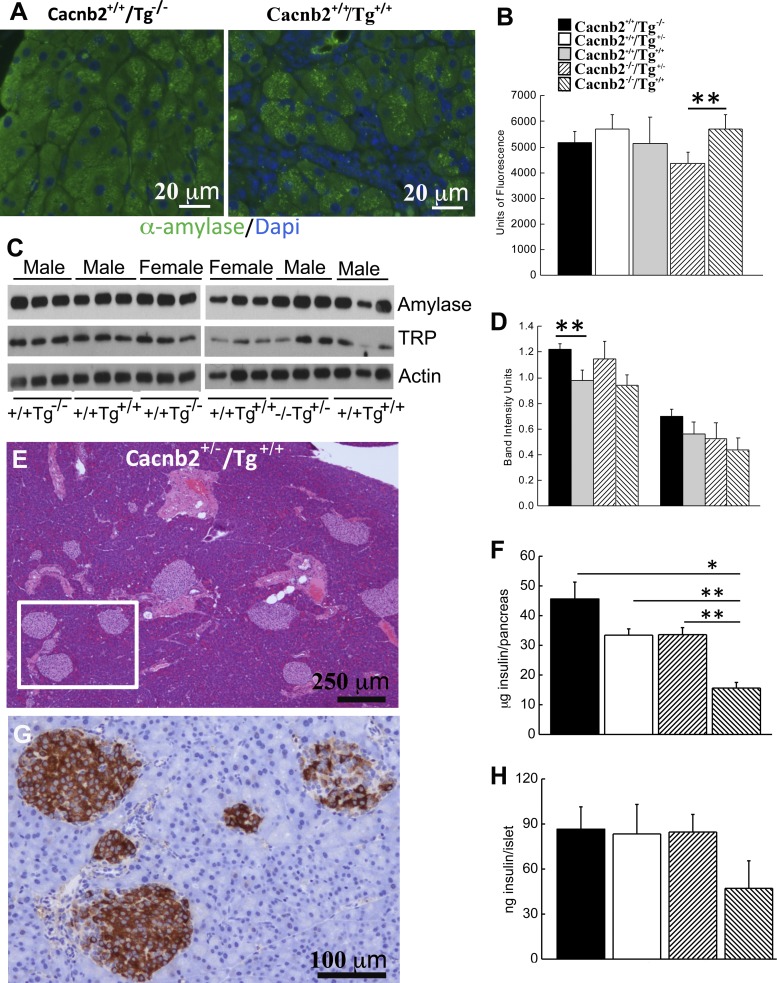
Fig. 11.
Tg+/+ mice exhibit changes in protein levels. A: immunohistochemistry of α-amylase. Left: pancreas from Cacnb2+/+/Tg−/− mouse. Right: pancreas from Cacnb2+/+/Tg+/+mouse. B: quantitation of α-amylase immunostaining in pancreas of different genotypes (n = 2–3 mice/group). **P < 0.0016. C: Western blot analysis of exocrine pancreas from Cacnb2+/+/Tg−/− and Cacnb2+/+/Tg+/+ mice. Amylase, α-amylase; TRP, trypsinogen. Lanes 1–3, male Cacnb2+/+/Tg−/−; lanes 4–6, male Cacnb2+/+/Tg+/+; lanes 7–9, female Cacnb2+/+/Tg−/−; lanes 10–12, female Cacnb2+/+/Tg+/+; lanes 13–15, male Cacnb2−/−/Tg+/−; lanes 16–18, male Cacnb2−/−/Tg++. D: quantification of Western blot band densities (n = 3 mice/group). **P = 0.025. E: H&E image of bloated pancreas where islets are plentiful and appear normal. F: insulin/pancreas is significantly lower in bloated Cacnb2−/−/Tg+/+ mice compared with other healthy genotypes. *P < 0.05. **P < 0.01. G: enlargement of area within the square shown in E and stained with hemoxylin and an HRP-conjugated insulin antibody. H: this difference was also observed when insulin content per 25 islets from Cacnb2−/−/Tg+/+ mice was compared with other healthy genotypes. *P < 0.05. In healthy mice, no significant differences were observed in total insulin/pancreas or insulin content/islet, measured from 25 isolated islets. Values are means ± SE.

