Fig. 6.
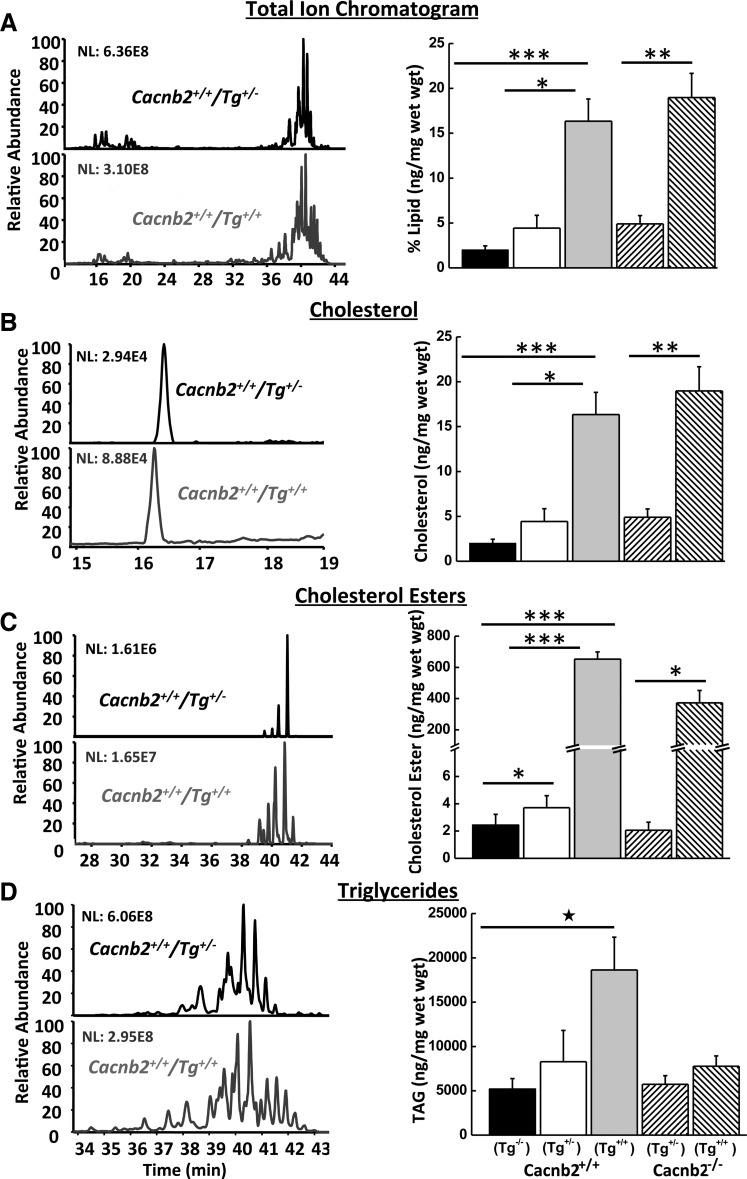
Mass spectroscopy analysis of 10 mg of total liver lipid from mice with different genotypes. Left: example chromatographs of lipid extracted from a bloated Cacnb2+/+/Tg+/+ (gray bottom traces) mouse (#197L) and a healthy Cacnb2+/+/Tg+/− (black top traces) litter mate (#197R); chromatograms are displayed as 100% of the most abundant peak. NL, normalized intensity level. Right: summary bar graphs of lipid content per milligram liver weight for the different genotypes: total lipid (A), cholesterol (B), cholesterol esters (C), and triglycerides (D). Values are means ± SE; n = 3/group. *P ≤ 0.05. **P ≤ 0.01. ***P ≤ 0.005.

