Fig. 9.
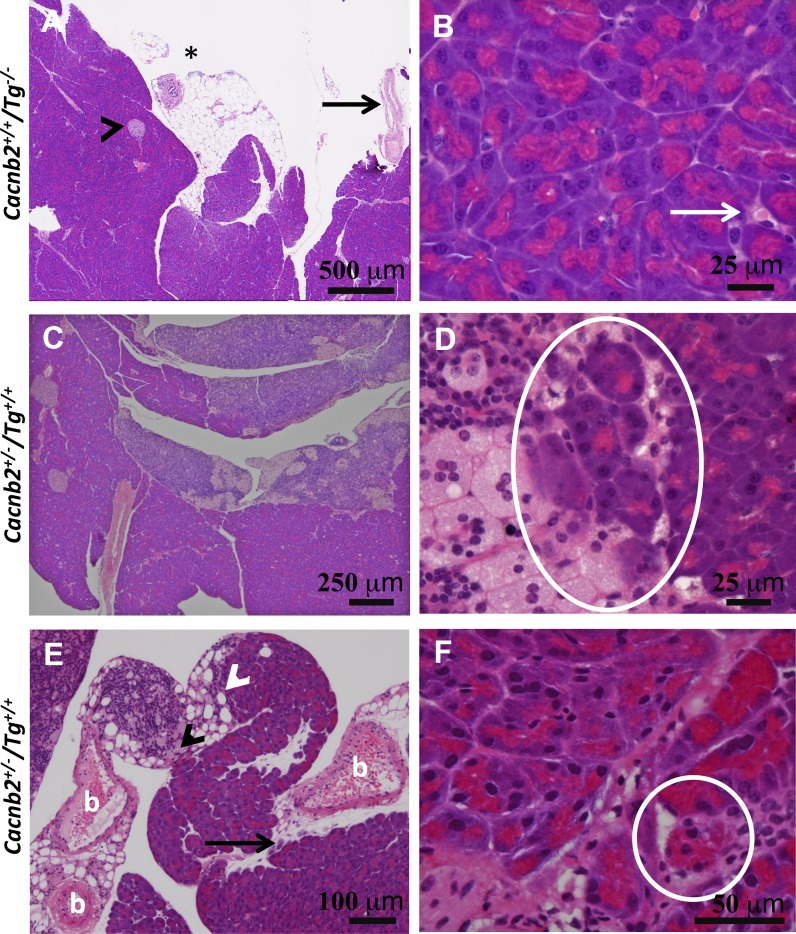
Immune cells infiltrate the pancreas of bloated mice. A: low magnification showing lobes of healthy acinar tissue with one islet (arrowhead). Adipose sheet shows an immune cell cluster (asterisk) and large artery (arrow). B: higher magnification from the same pancreas shows immune cells (arrow) within the pancreas. C: low magnification showing enlarged lymph glands attached to lobes of the exocrine pancreas of a bloated mouse. D: higher magnification of the same pancreas showing macrophages, small immune cell infiltration, and phagocytosis of acinar cells (circle). E: concentration of small immune cells (white arrowhead) and foam cells (black arrowhead), located at the junction between adipose tissue and an exocrine lobe of the pancreas from a second Tg+/+ mouse. Black arrow highlights a second example of immune infiltration and possible acinar cell phagocytosis by macrophages. b, Blood vessels with thickened walls. F: higher magnification of acinar tissue from the same pancreas as in E shows massive immune cell infiltration, fibrosis, and apparent phagocytosis of one acinar cell highlighted by a white circle.

