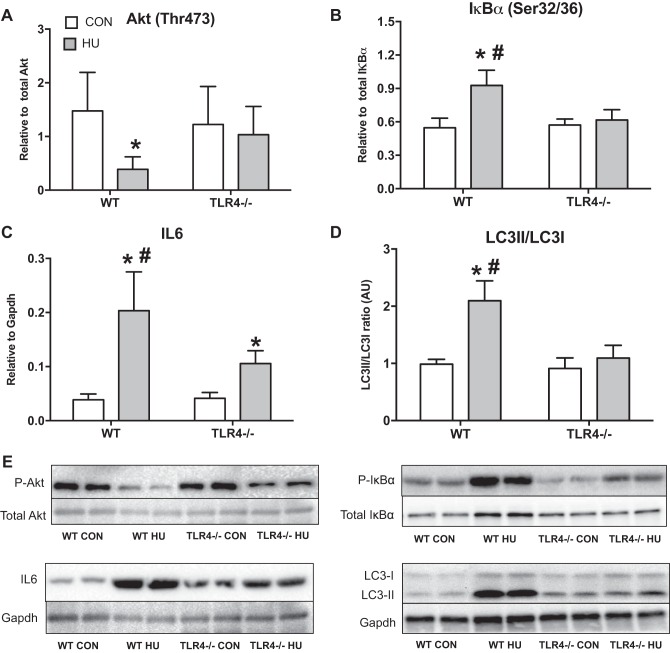
Fig. 2.
Skeletal muscle protein expression. Data (means ± SD; n = 6–8/group) in the figure are soleus samples from ambulatory control (CON; white bars) and after 14 days of HU (gray bar) in WT and TLR4−/− mice. Muscle homogenates were assessed by immunoblotting for Akt Thr-473 (relative to total Akt; A), IκBα Ser-32/36 (relative to total IκBα) (B), IL-6 protein expression (relative to GAPDH) (C), and microtubule-associated protein 1 light chain 3 (LC3)II/LC3I (D). E: representative Western blot images for each of the target proteins listed above. *Significantly different from respective CON (P < 0.05). #Significantly different from TLR4−/− HU (P < 0.05).

