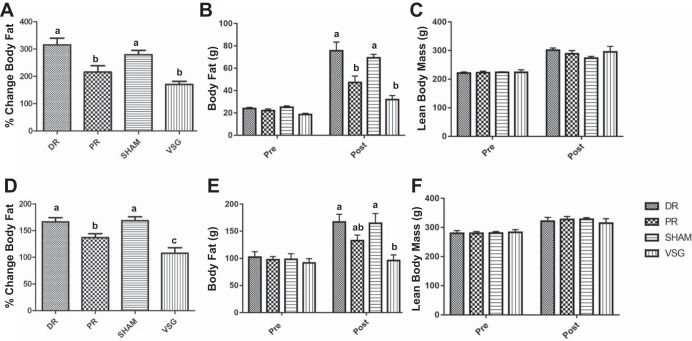
Fig. 4.
Body composition changes after surgery. NMR analysis of body composition presurgery and at day 63 postsurgery in the chow (A–C) and HFD (D–F) groups. Percent change in body fat in A and D show that the gain in body fat was significantly lower for both VSG and PR than for sham and DR in both chow and HFD groups, respectively. Body fat gain was similar in VSG and PR in the chow group, while significantly higher in PR, as compared with VSG in the HFD group. Absolute body fat presurgery and day 63 post-surgery are shown in chow (B) and HFD groups (E), respectively. Although there was a main effect of time, such that lean mass increased over time, there were no statistical differences in lean mass either preoperatively or postoperatively between surgeries in both chow (C) and HFD (F) groups. P < 0.05. Letters above bars that differ indicate a significant difference.

