Fig. 3.
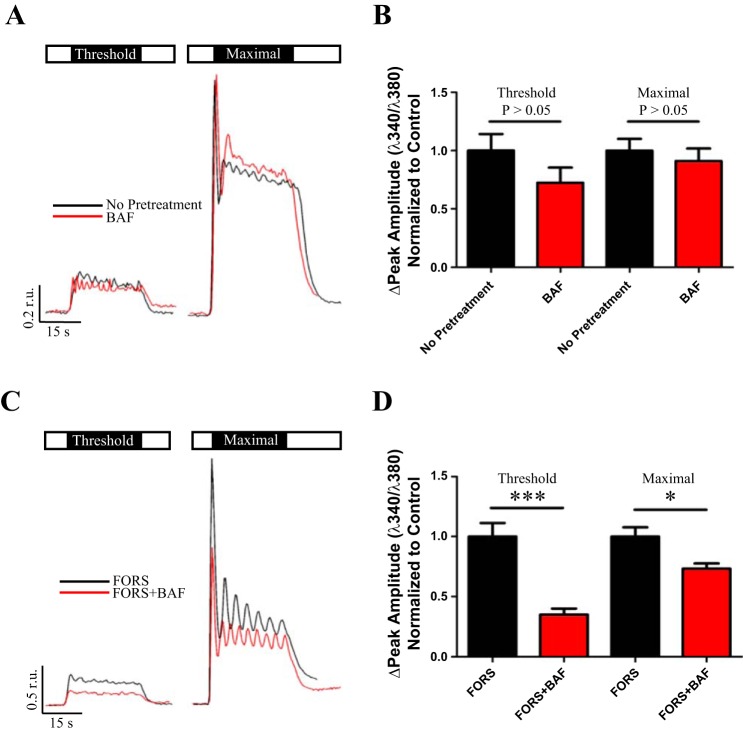
cAMP-dependent recruitment of acidic organelle Ca2+ release. Open box represents saline, and black box indicates duration and concentration of CCh stimulus. Acini were stimulated at threshold and maximal concentrations of CCh in the absence (A, black trace) or presence of BAF pretreatment (A, red trace). Compared with CCh alone responses [0.24 ± 0.034 r.u., n = 17], there was no change in the peak amplitude of Ca2+ release following BAF treatment (0.17 ± 0.031 r.u., n = 17, P = 0.16) at a threshold level of stimulation (B). Additionally, there was no significant change in peak amplitudes of CCh alone responses (1.3 ± 0.13 r.u., n = 17) compared with BAF + CCh peak amplitudes (1.2 ± 0.14 r.u., n = 17, P = 0.55) at maximal stimulation (B). However, when FORS-treated acini were stimulated at threshold and maximal concentrations of CCh with (C, red trace) or without (C, black trace) BAF pretreatment, there was a significant diminishment (D) in the threshold peak amplitude of initial Ca2+ release (0.11 ± 0.016 r.u., n = 6, ***P = 0.0004) compared with FORS alone responses (0.31 ± 0.035 r.u., n = 6). This was also true for maximal stimulation (D), with FORS alone peak amplitudes (2.2 ± 0.17 r.u., n = 6) significantly reduced following BAF treatment (1.6 ± 0.096 r.u., n = 6, *P = 0.013).

