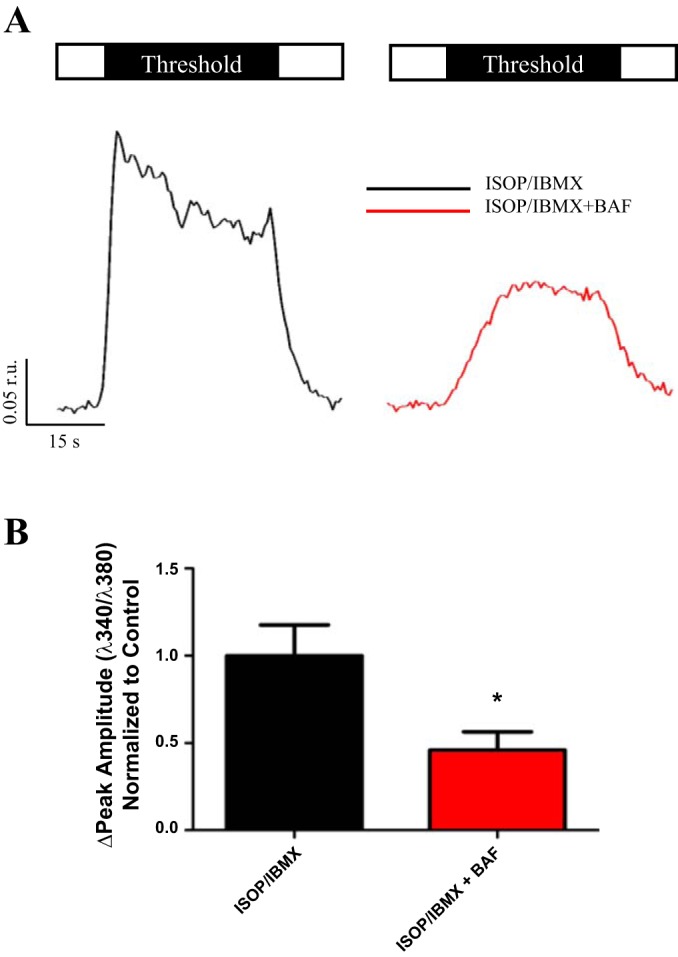
Fig. 4.

ISOP evoked elevations in cAMP. Open box represents saline, and black box indicates duration and concentration of CCh stimulus. Acini were stimulated at a threshold concentration of CCh following elevation of cAMP via ISOP/IBMX in the absence (A, black trace) or presence (A, red trace) of BAF pretreatment. Compared with ISOP/IBMX alone responses (0.27 ± 0.048 r.u., n = 13), there was a significant reduction in the peak amplitude of Ca2+ release following BAF treatment (0.13 ± 0.029 r.u., n = 11, *P = 0.020) at a threshold level of stimulation (B). Responses to maximal stimulation were not significantly different following BAF treatment.
