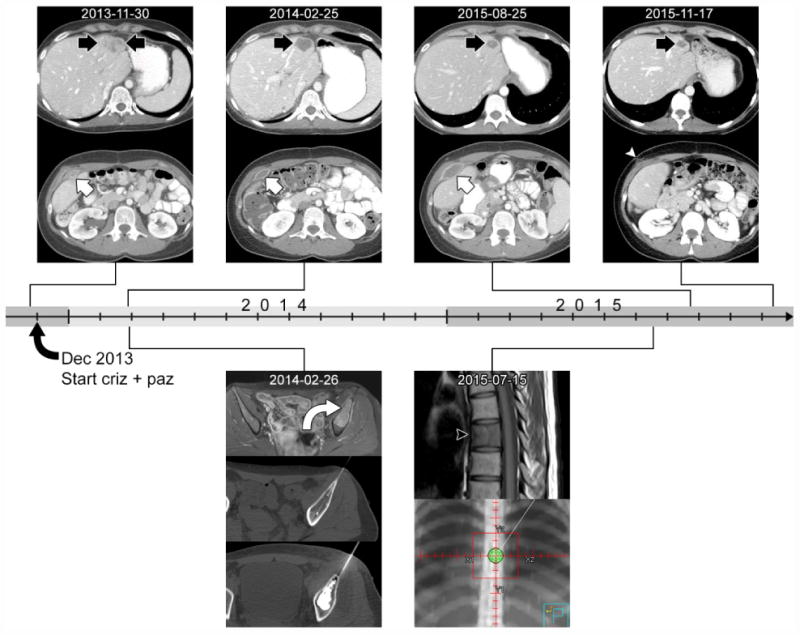
Figure 3.

Time course of imaging response following initiation of crizotinib and pazopanib in early December 2013. The CT images above the timeline show the response of a liver lesion (black arrow) and an abdominal wall lesion (white arrow) to therapy. The liver lesion had heterogeneous enhancement at the baseline CT from November 2013. On follow-up imaging, it decreased in size and degree of enhancement, developing central low-attenuation representing necrosis. The abdominal wall lesion also had heterogeneous enhancement at baseline and decreased in degree of enhancement on subsequent CTs. In contrast to the liver lesion, it enlarged and became symptomatic, and was finally resected in September 2015. Post-operative CT from November 2015 shows the surgical scar (white arrowhead). The images below the timeline show other lesions that underwent local control. In February 2014 contrast-enhanced T1-weighted MR image shows a bone metastasis in the left ilium (curved arrow, top row). This subsequently underwent cryoablation (middle row) followed by cement augmentation (bottom row) to reduce risk of pathological fracture. In July 2015, a metastasis was detected on MRI at T7 (black arrowhead on T1-weighted image). This lesion underwent palliative radiation to a dose of 2000 cGy in 5 fractions (bottom row, radiation therapy planning image).
