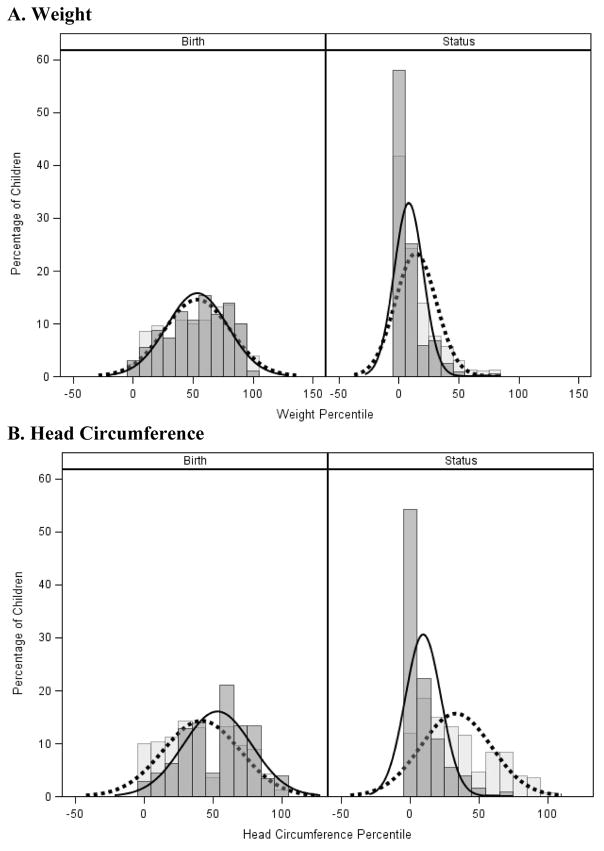
Figure 2. Distribution Curves at Birth and Discharge.
Graphical depiction of weight and HC percentiles at birth and status in growth-restricted infants with (light gray, dashed line) and without (dark gray, solid line) PHS. The bars are constructed as histograms and the lines represent smoothed density curves. Note the expected leftward shift in weight percentiles between birth and status (A), and the preservation of head growth percentile in infants with PHS (B).

