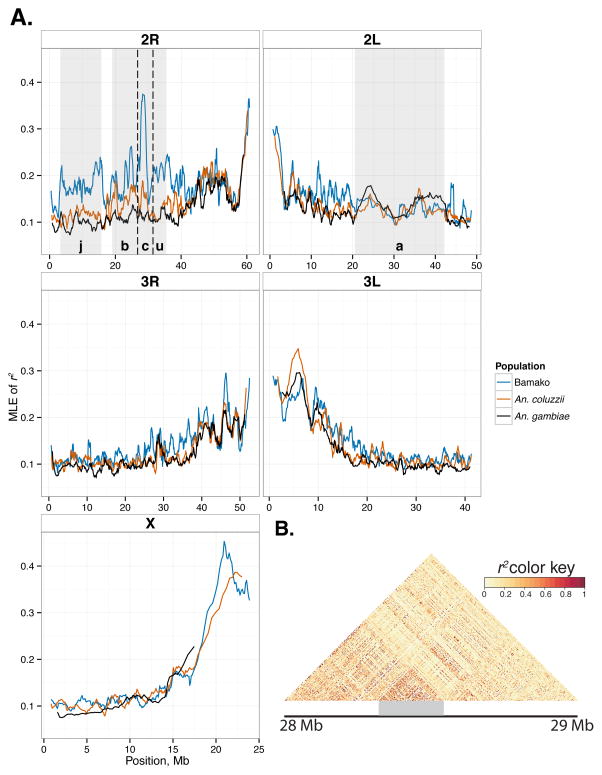
Fig. 3.
Analysis of linkage disequilibrium (r2) in Bamako, typical An. gambiae and An. coluzzii. (A) Sliding window analysis of LD between SNPs separated by 200–300 bp on the same set of reads in population pools (bin, 1000 SNPs; step 100 SNPs). Shaded boxes denote chromosomal inversions. (B) LD within 10 individual Bamako sequences, shown for the portion of chromosome 2R spanning 28 Mb to 29 Mb.

