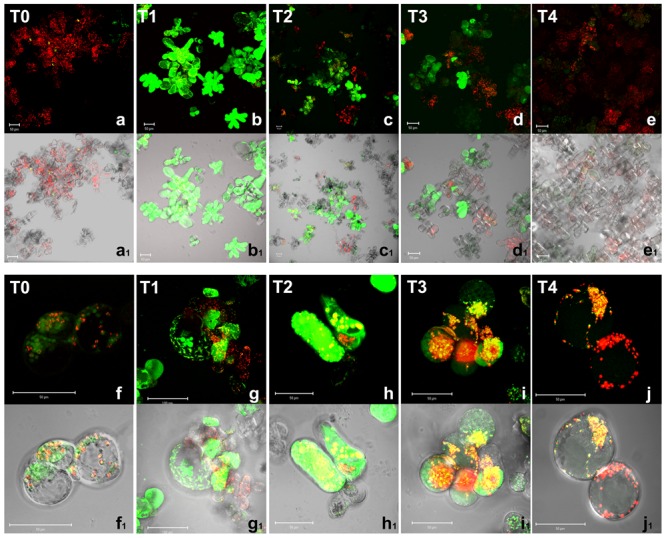
FIGURE 3.

Nitric oxide detection by confocal microscopy in A. thaliana cell suspension cultures. Cells were grown in bioreactor in normoxic conditions (T0), subjected to anoxia 2 h (T1) or 4 h (T2) and re-oxygenation 2 h (T3) or 20 h (T4). Merged two-color confocal images (a–j) of the green and the red channel show autofluorescence of chloroplasts (red false color) and NO (green false color) detected by DAF-2 DA probe. In (a1–j1), the confocal microscopy images are digitally merged with the transmitted light images for displaying the number of labeled cells in the total cell population and the cellular localization of the fluorescent probe. (f–j) and (f1–j1) are at higher magnification. Excitation wavelength 488 nm line, emission was detected at 505–530 nm band pass filter and 650 nm long band-pass filter. Scale bar = 50 μm.
