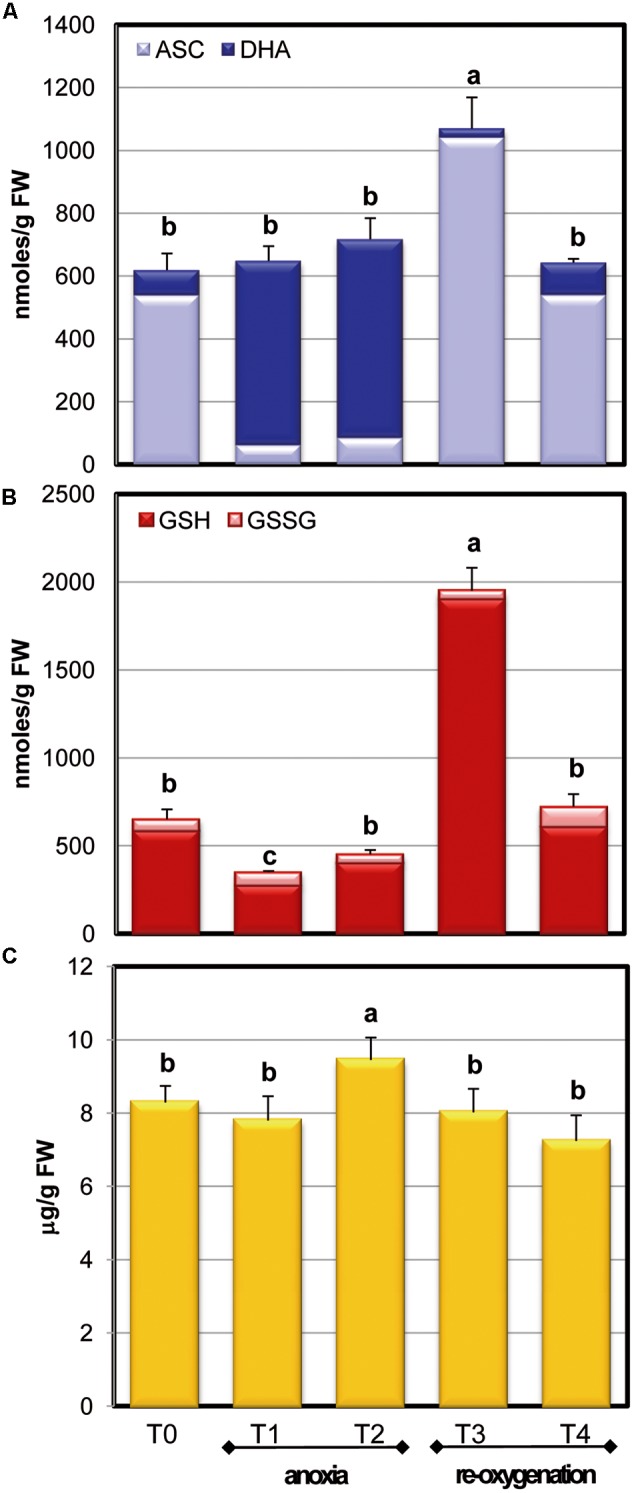
FIGURE 4.

Effects of anoxia and re-oxygenation on ASC pool, GSH pool, and α-tocopherol in A. thaliana cell suspension cultures. ASC +DHA (A) and GSH+GSSG (B) contents are expressed as nmoles/g FW; α-tocopherol (C) as μg/g FW. Data represent the means (±SE) of five experiments. Different letters represent values which are statistically different (by one-way Anova test).
