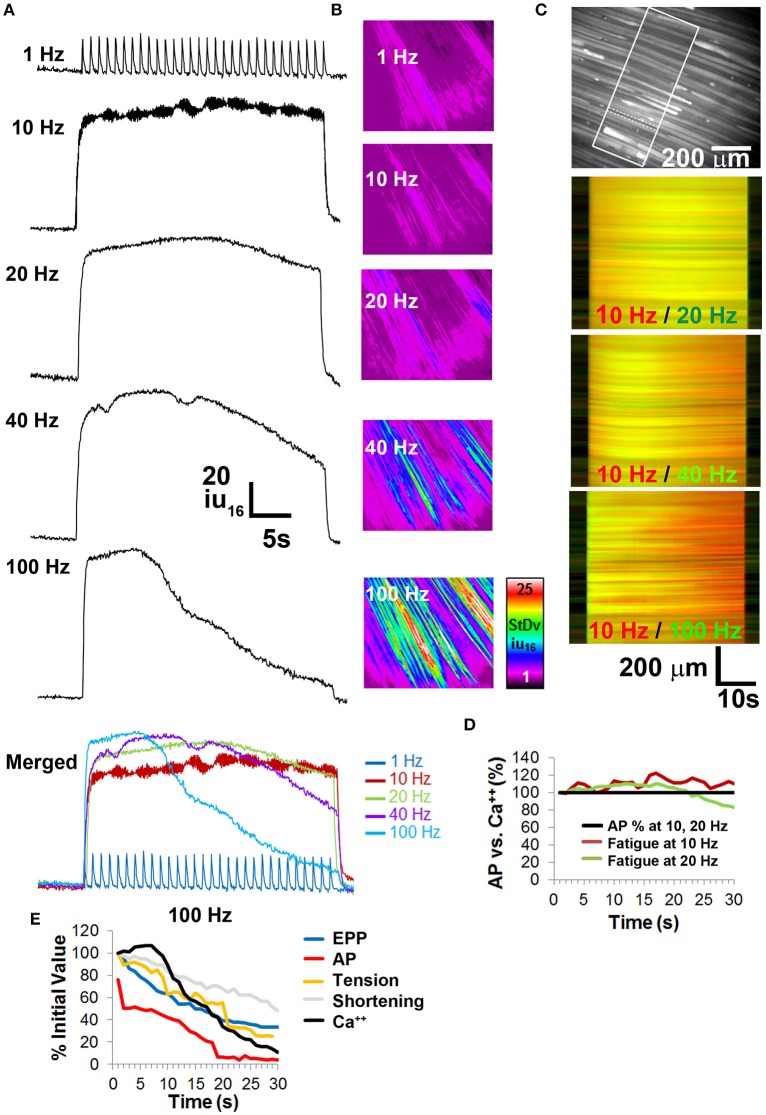
Figure 6.
Calcium imaging studies in whole diaphragm show no fatigue in response to frequencies of nerve stimulation that show no neural transmission failure. (A) Representative standard deviation (SD) of calcium intensity changes (16-bit intensity units; iu16) within BHC-treated muscle fibers from the diaphragm of CAGGS-GCaMP3 mice in response to different frequencies of tonic nerve stimulation. (B) Spatio-temporal (ST) maps of the standard deviation (SD) of intensity represent the loss of intensity over time as a signal that increases with nerve stimulation frequency. (C) Top image illustrates the region of the costal diaphragm, the dotted lines surround a muscle fiber from which the intensity changes in (A) were generated. Boxed region shows population of muscle fibers whose intensities signals were tracked over time for SD maps in (B) or intensity map subtractions in (lower three images in C). Lower images represent differential ST maps of calcium intensity over time in response to different frequencies of nerve stimulation. In the 10/20 Hz comparison, the yellow signal from left to right indicates that the 10 and 20 Hz ST intensity maps (red, green) are equally maintained over the 30 s duration, whereas the red signal in the bottom two comparisons indicates a loss of signal in the green 40 or 100 Hz ST intensity maps over time. (D) No significant loss of calcium signal is observed over time at frequencies that fail to induce NTF. (E) Comparison of EPP rundown, AP transmission success rate, muscle force via tension or shortening, and calcium intensity, in response to 100 Hz nerve stimulation.

