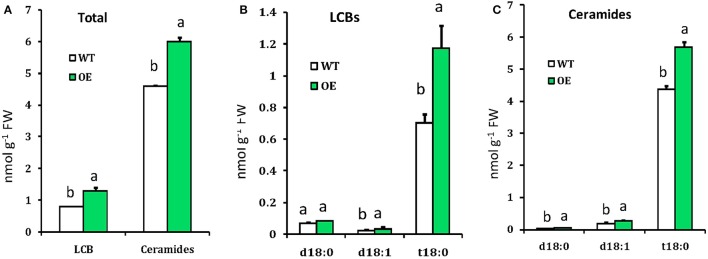
Figure 3.
Measurement of sphingolipids in WT and OE plants. (A) Total LCBs and ceramides in indicating plants. (B) Free LCBs composition. (C) LCB moiety distribution of ceramide species. Values represent means ± SE from three independent experiments. Different letters indicate significant differences (P < 0.05) between the treatments.

