Figure 6.

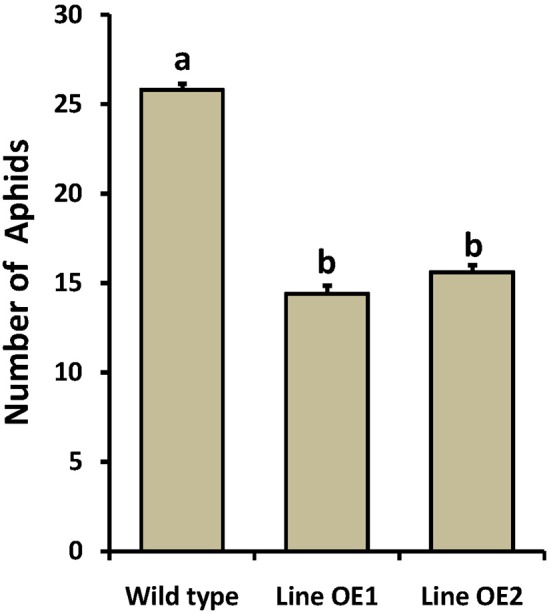
Population density of the green peach aphid in WT and OE Arabidopsis plants. Values represent means ± SE from 15 independent experiments. Different letters indicate significant differences (P < 0.05) among the treatments.

Population density of the green peach aphid in WT and OE Arabidopsis plants. Values represent means ± SE from 15 independent experiments. Different letters indicate significant differences (P < 0.05) among the treatments.