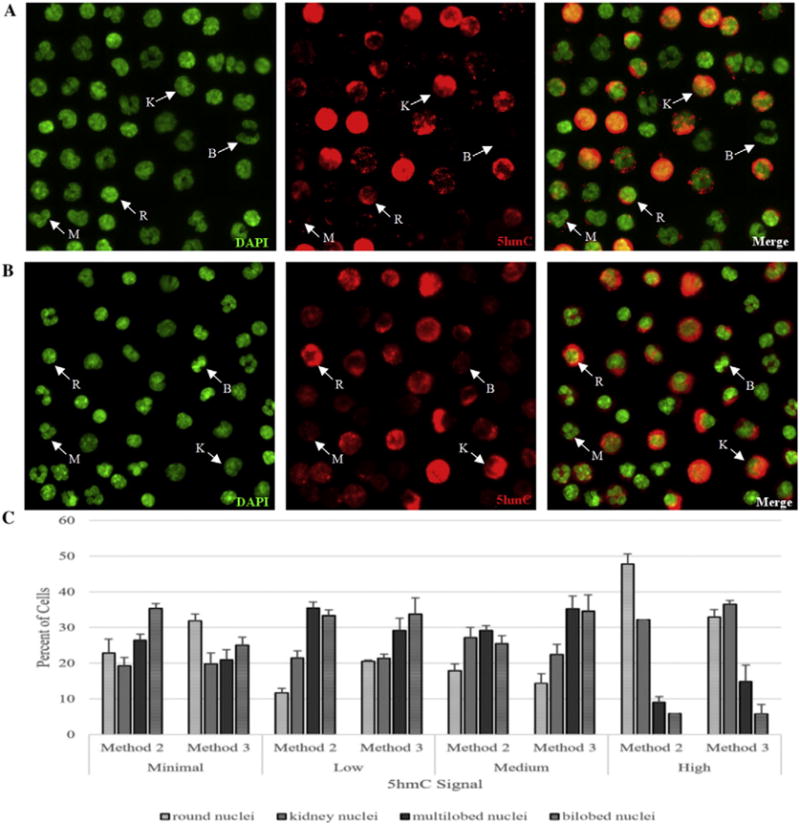
Fig. 4.

Immuno-fluorescent analysis showed a wide distribution of 5hmC levels among various classes of leukocytes. A. Total human leukocyte fraction from fresh peripheral blood (method 2) were labeled with DAPI for DNA (fluorescent green), primary antibody to 5hmC and secondary R-PE (red fluorescence), and then the merged image of DAPI and 5hmC is also presented. The same field of cells is shown in all images. B. Total human leukocyte fraction from frozen peripheral blood (method 3) were labeled with DAPI for DNA (fluorescent green), primary antibody to 5hmC and secondary R-PE (red fluorescence), and then the merged image of DAPI and 5hmC is also presented. The same field of cells is shown in all images. Example cells are labeled based on nuclear morphologies. K: kidney shaped (monocytes or natural killer cells), R: Round (T cells and B cells), M: Multilobed (neutrophils), B: Bilobed (eosinophils). C. 5hmC signal was quantified, and categorized as minimal, low, medium or high for each of the nuclear morphologies in each isolation method (fresh blood: method 2, frozen blood: method 3) and the percent of cells for each nuclear morphology was plotted for each 5hmC signal. Error bars represent standard error of the mean.
