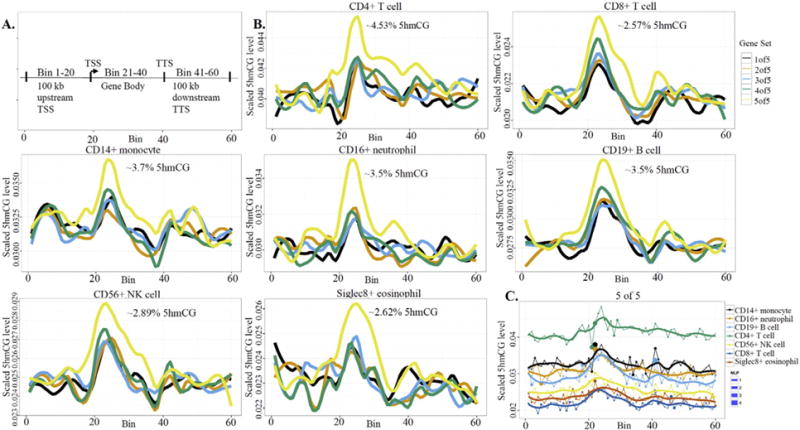
Fig. 5.

Gene-region-specific 5hmCG levels are distinct among the peripheral leukocyte types and vary by transcript level. A. Map defining the three gene regions assayed (Lister et al., 2013). B. 5hmCG levels were plotted for each of the seven leukocyte types by quintile of transcript expression level. The peak percentage of 5hmCG relative to total CG content for each cell type is estimated at the top of each graph. C. The 5hmCG levels for the quintile of the highest quintile of transcript for each cell type was plotted together. The dots plotted with each line on the graph represent the degree of change from the previous regions level of 5hmCG to the current level. The figure legend to the right of panel C shows the varying levels of significance of this change as determined by NLP. The relative position of each cell type is the same when these data are plotted for the other 4 quintiles of transcript expression (Supplemental Fig. 4).
