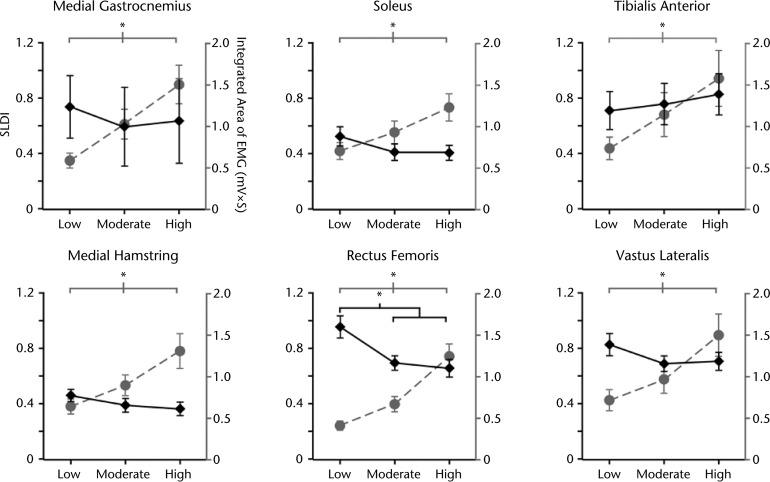
Figure 2.
Muscle activity and Spastic Locomotor Disorder Index (SLDI) in specific lower extremity muscles at different levels of exercise intensity. Increases in locomotor exercise intensity led to significant increases in measures of overall muscle activity (plotted in gray) in each of the tested muscles (n=16). Most tested muscles demonstrated a nonsignificant trend for decreased SLDI (plotted in black) with increases in exercise intensity (n=16). Exceptions include the rectus femoris muscle, in which the SLDI significantly decreased, and the tibialis anterior muscle, which nonsignificantly increased at higher levels of intensity. *P<.01. EMG=electromyography.

