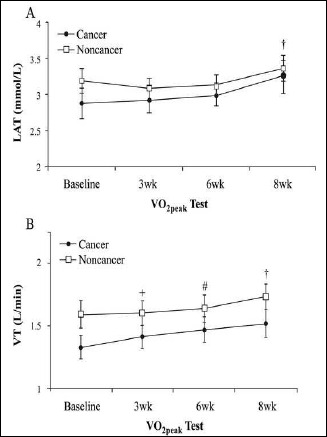
Figure 2.

Comparison between cancer survivors and non-cancer participants for lactate concentration at the lactate threshold (LT, A) and ventilatory threshold (VT, B) responses at baseline, 3-wks, 6-wks, and 8-wks of aerobic training. + Significant difference from baseline to 3wk (main effect, p < 0.05). # Significant difference from 3wk to 6wk (main effect, p < 0.05). † Significant difference from 6wk to 8wk (main effect, p < 0.05). Values are means + SEM.
