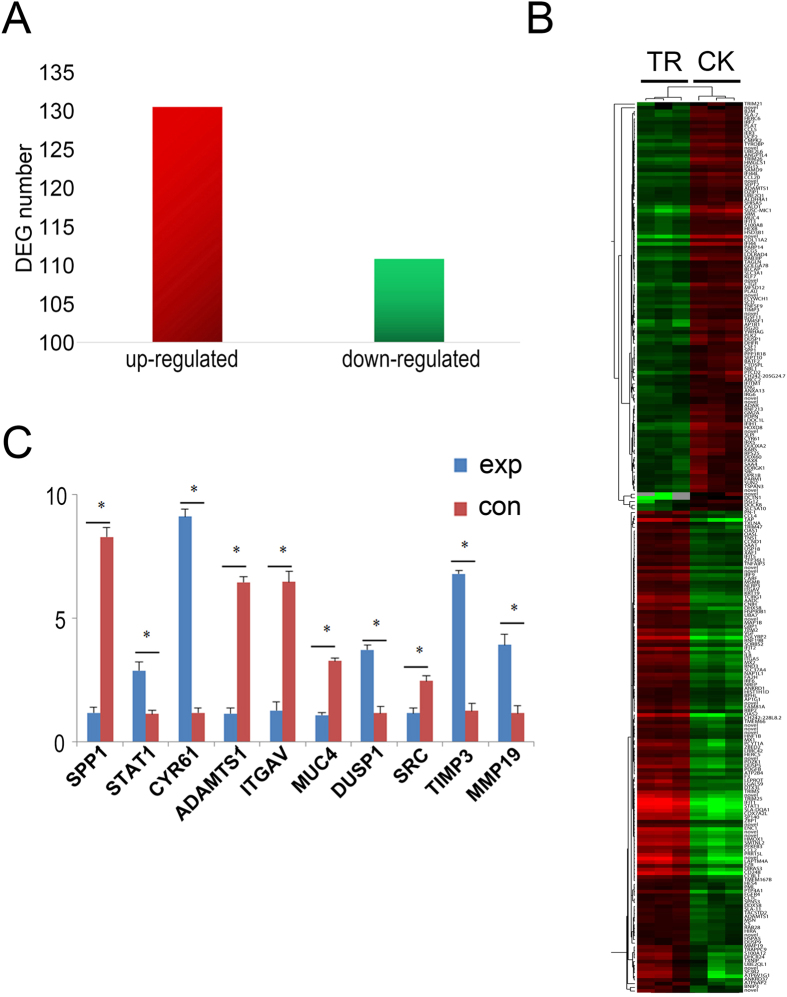
Figure 1. Analysis of differentially expressed genes.
(A) DEGs (FDR ≤ 0.001 and |log2 Ratio| ≥ 1) identified between TR and CK. (B) The heatmap of the subset DEGs in different samples (TR1, TR2, TR3, CK1, CK2, CK3). (C) Several DEGs related to embryo development from RNA-seq data were screened for validation by qRT-PCR.

